
This MegaRoller project blog post was written by Henrik Kalisch, University of Bergen, Volker Roeber, Université de Pau et des Pays de l’Adour, E2S-UPPA, chair HPC-Waves, SIAME and University of Bergen.
As part of the MegaRoller wave energy research project, the University of Bergen has improved a model to better predict wave behaviour close to shore.
MegaRoller is a collaboration between industry and academic institutions, focused on the design of efficient power take-off (PTO) unit and control systems for the next generation 1MW oscillating wave surge convertor devices.
More knowledge = more efficient wave energy systems
These devices are deployed underwater close to the shore where wave activity varies significantly. In order to develop a commercially viable system, MegaRoller has brought together scientists from across Europe to fine-tune the WaveRoller technology developed by AW Energy.
The MegaRoller project aims to bring power uptake efficiency to above 80%, boosting power density, extending system life and reducing operational and maintenance cost.
The software algorithm developed by MegaRoller partner “Leibniz Institute for Neurobiology ” predicts wave activity up to 20 seconds into the future, allowing the PTO’s wave-by-wave damping control to run at optimal efficiency.
But in order for the team to develop an effective algorithm, they need accurate data. We are developing a model for MegaRoller that takes data from a broader wave forecasting model covering an entire ocean basin and delivers a detailed wave forecast in the nearshore region.
A different approach more relevant to near-shore wave activity
Most ocean wave models are based on a spectral approach that covers a whole ocean basin. This takes an integrated energy perspective and does not consider wave-by-wave fluctuations. While these models work well for many applications, they are not ideal in a near-shore context.
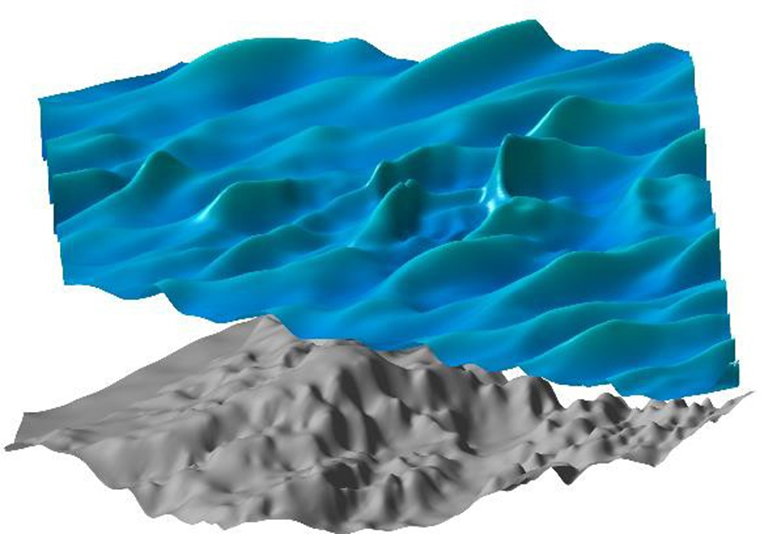
The single most important factor for the PTO to know is expected wave height, which has a very close relationship with water depth. To achieve this, we tried to replicate a 3D environment on a 2D horizontal plane to tell the full story: from initial build-up to the breaking and dissipation, and then the recirculation at the shore. For modeling the waves, we adapted the Boussinesq Ocean and Surf Zone (BOSZ) model developed by the second author over many years.
The latter point is important to MegaRoller. These devices are located near to the shore, with some potential installations as close as 300 metres. This nearshore zone experiences strong wave focusing, wave breaking and also wave-driven currents, hence detailed knowledge of the wave field around the installation site is necessary. The BOSZ model was extended for this purpose with a multi- directional wave generation function and an improved wave energy dissipation mechanism for breaking waves.
Benchmarking from lab experiments
A major challenge in developing models is that analytic solutions are complex and difficult to find. However, lab experiments can be run in a controlled environment to focus on the required physical processes.
We benchmarked our model against several data provided by previously conducted laboratory experiments to look at the properties of each individual wave as well as the aggregate. We achieved good matches for quantities such as wave skewness and asymmetry as well as the overall spectral composition at multiple points across the surf zone. This validates the applicability of the model to account for the nonlinear transformation of nearshore waves and the generation of second-order processes such as infra-gravity waves (long energetic waves fueled by wave breaking and other surf zones processes).
Helps with site selection
Our model can also help in the site selection process. One feature can mimic the presence of a wave convertor device. This helps to understand the potential impact of installing multiple devices in a wave farm arrangement to help decide on the optimum location and number of devices.
The near-shore model can also be used to model energetic wave scenarios that could help forecast flooding, and to understand the forces on ocean structures in a simplified way. Here is an example of the Peniche site where a WaveRoller is already deployed.
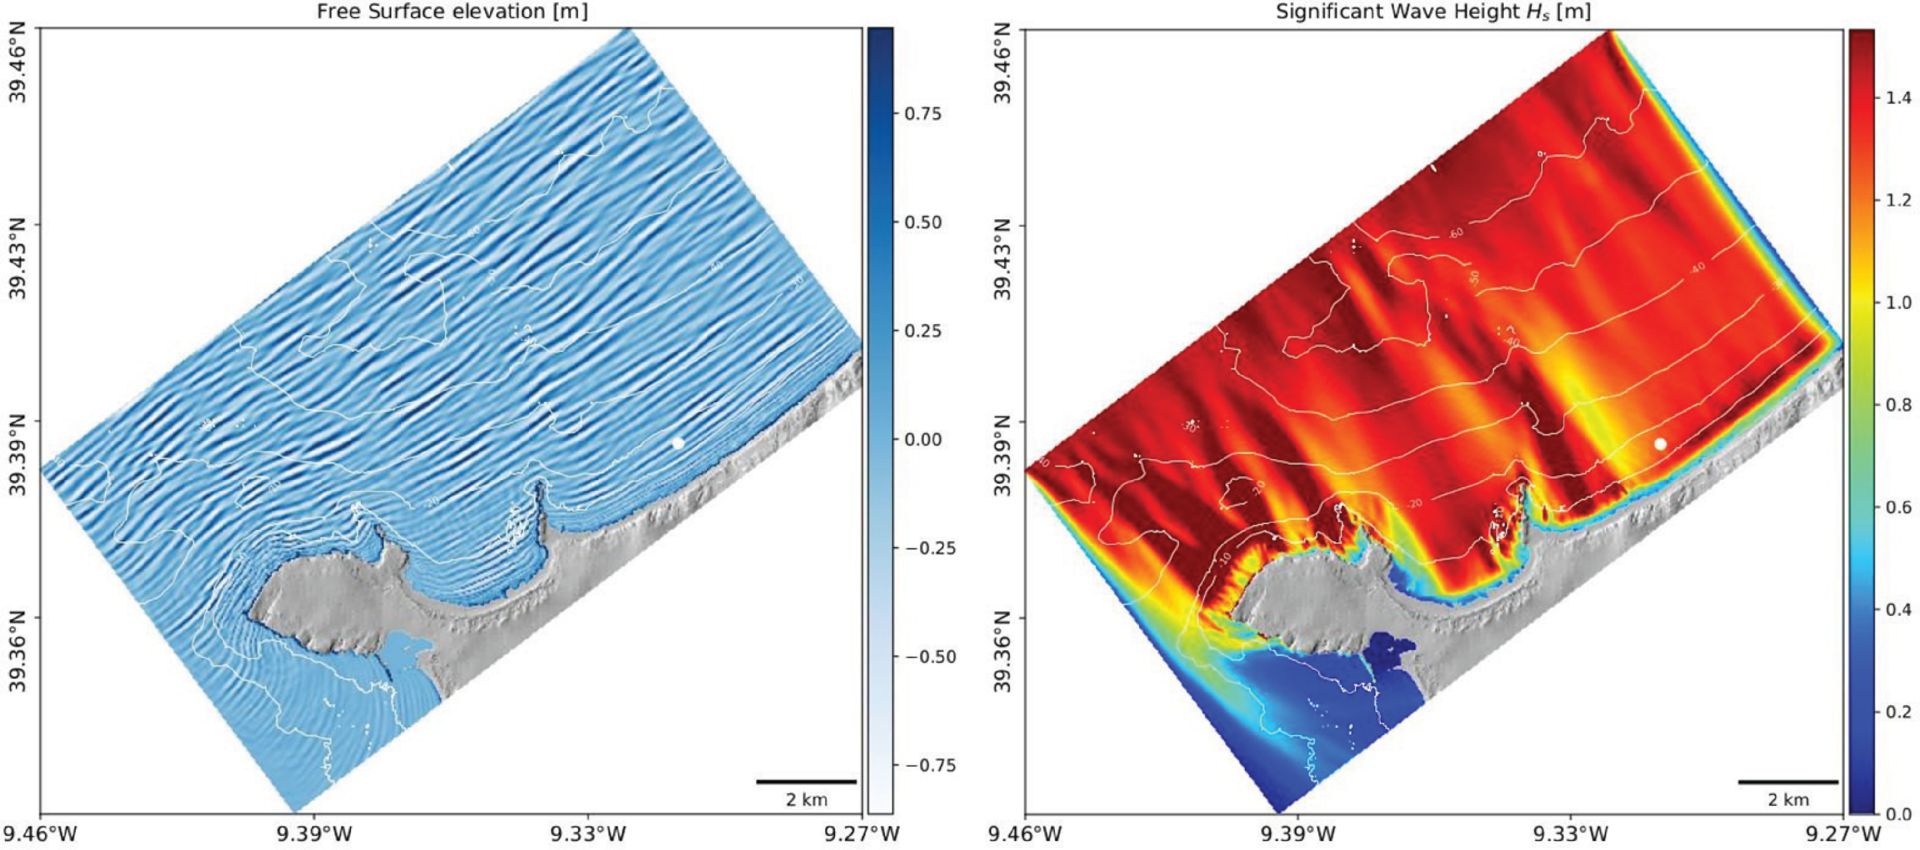
Left figure: Snapshot of the ocean surface after 90 min of computation showing wave crests and troughs from an incoming swell with 1.5m significant wave height and 15 sec peak period.
Right figure: Significant wave height (statistical value corresponding to the average height of the highest 33% of all waves) showing zones of wave focusing as a consequence of the local bathymetry around Peniche. The abrupt transition in color near the shore is due to wave breaking with sudden dissipation of wave energy.


Comments
No comments yet. Be the first to comment!