
This article is written by Patrick May from Lancaster University. Patrick works on MegaRoller together with his former colleagues at the MegaRoller partner institute, Leibniz Institute for Neurobiology in Magdeburg, Germany.
The ability to predict the height of future waves is essential in order to design an efficient ocean wave energy system. To tackle the problem of prediction, MegaRoller researchers turned to a surprising form of inspiration: the human auditory system.
MegaRoller is a collaborative research and innovation project which aims to develop and demonstrate the feasibility of a next-generation power take-off (PTO) solution for 1MW oscillating wave converters. The project received funding from the European Union’s Horizon 2020 research and innovation programme.
Predicting the future
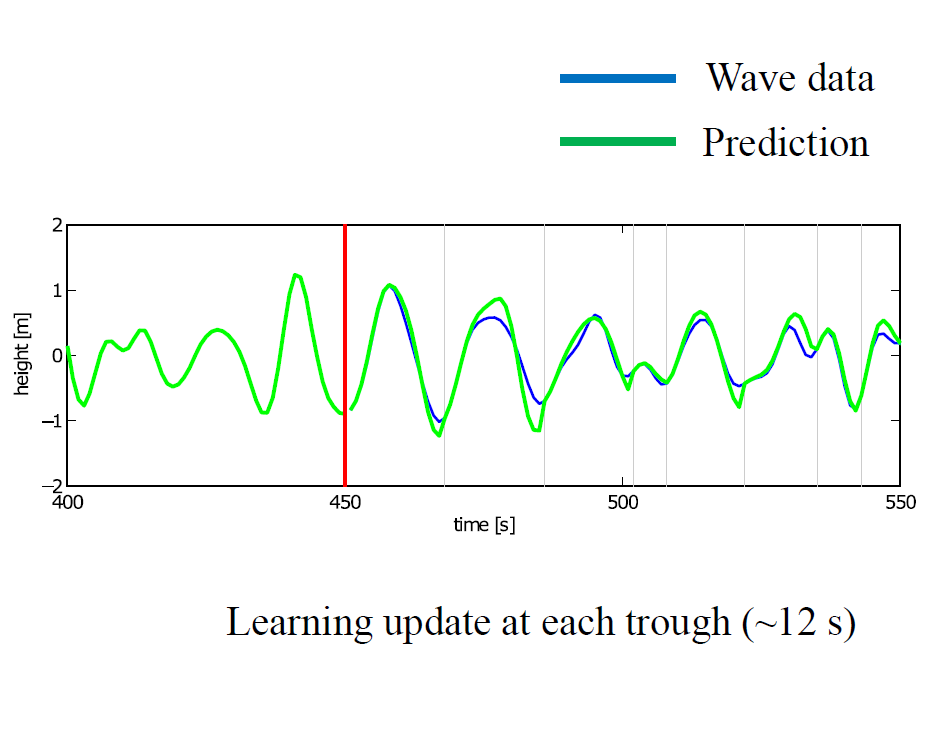
For the successful commercial application of such technology, efficiency is everything. The project required a software algorithm that could predict ocean wave activity 10-20 seconds into the future. That’s crucial for the innovative PTO—that has wave-by-wave damping control—to run at optimal efficiency, maximising energy output.
For data, we have been using the Boussinesq Ocean and Surf Zone (BOSZ) model developed by our MegaRoller partners Henrik Kalisch and Volker Roeber at the University of Bergen, Norway. This produces realistic simulations of near-shore wave activity.
More from MegaRoller: Wave Energy: The Standardisation of the Industry
But how to predict incoming waves based on such data? Reinhard König and Artur Matysiak, my colleagues in Magdeburg, and I turned to the human auditory system for inspiration.
I knew from my background as an auditory neuroscientist that the hearing system of the brain is specialised in extracting information from a one-dimensional signal—sound waves hitting the ear drum—and that ocean wave data is similarly one-dimensional. It therefore made sense to see if the processing solutions of the brain could be beneficial for building a wave prediction algorithm.
Adapting an echo state network
Deep neural networks are the big thing now, but their computational requirements instantly ruled them out. Instead, we looked at a proven 15-year-old approach: echo state networks.
As with any kind of artificial neural network, you feed in inputs, and the system dynamics and the connections between the network’s units then determine what output you get. With deep learning, you train all the connections, which makes it computationally expensive. But with echo state networks, you leave the network alone and train only the output connections.
We modified a vanilla echo state network so that it would mimic the auditory system of the brain. We pre-processed the input by breaking down the signal into different frequency components thereby creating a frequency map, a so-called tonotopic map, of the incoming wave. This is roughly how the inner ear works: it creates a tonotopic map of sound and then feeds this into the auditory nerve, the initial part of the auditory pathway. This pathway then continues all the way to the auditory cortex, the part of the folded, outer layer of the brain that processes sound information. In auditory cortex, we find lots of tonotopic maps connected to each other in a hierarchical structure.
By pre-processing the input, and by organising the network into multiple tonotopic maps, we achieved superior results than by just using a vanilla echo state network. We also found that this model inspired by the auditory brain achieves good performance across parameter values and across sea states. That is, one doesn’t need to fine-tune the network for it to perform well, and you get good predictions regardless of what the sea is doing.
Finally, online prediction is mixed with offline training for the MegaRoller implementation. This means that any standard laptop can carry out the prediction task in a fast and efficient way.
Other possible applications
So far, for the MegaRoller project, we have been focused on using this approach to predict only a few ocean waves into the future. As for extending this approach, I’ve been talking to Chris Ridgewell, the CEO of AWE-Energy—the company behind MegaRoller. We think it might be feasible to widen the prediction window into minutes and perhaps even longer. One possibility could be to predict storms through infragravity waves, ocean waves with very low frequency.
We have also discussed using our algorithm to help dynamic positioning in, for example, oil rigs. Beyond ocean waves, I would be interested to see how well our approach predicts EEG brain waves, which might be helpful for epilepsy research.
This article is written by Patrick May from Lancaster University. Patrick works on MegaRoller together with his former colleagues at the MegaRoller partner institute, Leibniz Institute for Neurobiology in Magdeburg, Germany.


Comments
No comments yet. Be the first to comment!