

Energy-efficient voyage planning may sound like one decision. In practice, it is two: when to throttle back to meet a fixed arrival time, and which route to take across the ocean. We analysed 48 weekly Atlantic crossings to quantify each – and their combined impact.
The set up
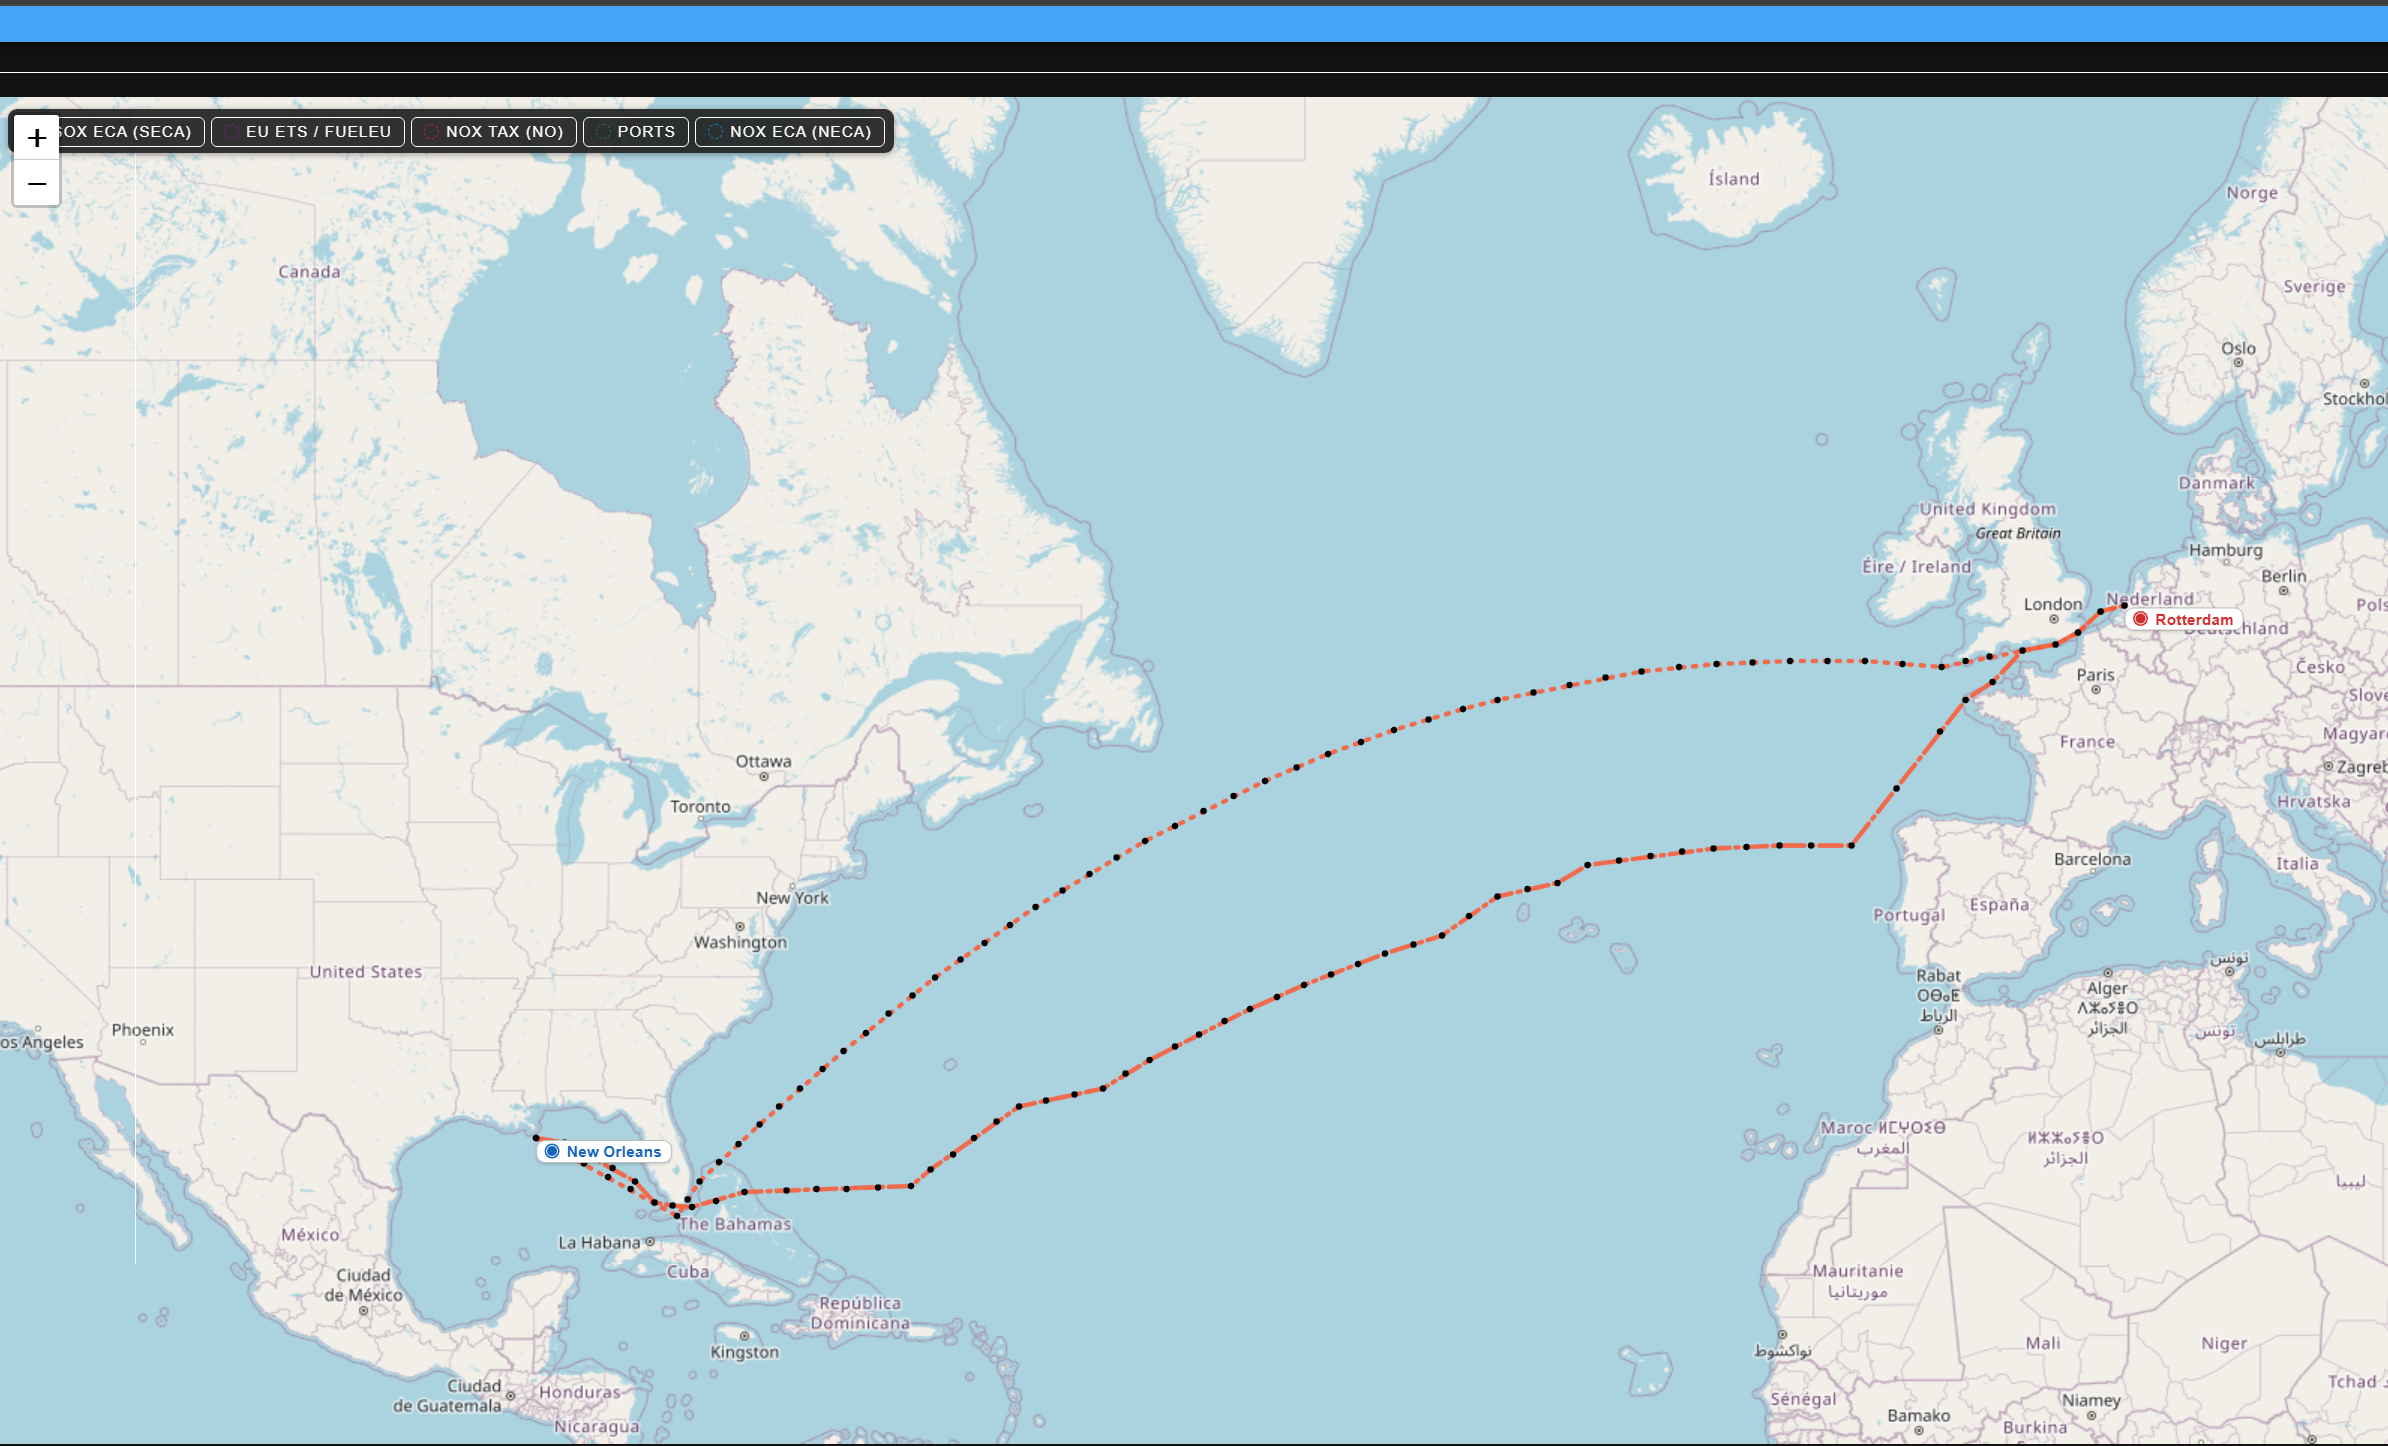
We analysed the New Orleans–Rotterdam route, a North Atlantic crossing with pronounced seasonal variation and a well-known operating corridor. The baseline scenario was defined as a great-circle route between the ports, sailed at constant speed to meet a fixed arrival time. That would be considered the optimal voyage if no speed planning or weather routing was applied.
We then simulated 48 North Atlantic crossings, weekly departures from October 2023 to August 2024, each within a fixed 18-day envelope. The vessel was SINTEF Ocean Bulk Carrier (SOBC-1), an open-hull research testbed, with identical loading conditions across all runs.
Historical Copernicus data (winds, waves and currents) were applied for each departure date. The only variable between voyages was which decisions our weather-routing software, EcoRouter, was allowed to optimise.
For each weekly departure, we computed three voyages for the same ship, all with identical arrival times and weather conditions, to isolate the energy-saving potential of two operational levers: variable speed and weather routing:
- Voyage A – shortest path, constant speed. EcoRouter does not optimise. The vessel follows the great-circle reference route at a fixed speed set to meet the planned arrival time.
- Voyage B – shortest path, variable speed. EcoRouter is allowed to vary speed leg by leg along the shortest path to minimise energy consumption, while still meeting the planned arrival time. This isolates the speed-planning lever.
- Voyage C – globally optimal. EcoRouter is free to optimise both route and speed against the actual weather conditions. Both levers active.
Comparing voyage A, B and C let us measure what each operational lever is worth – separately and combined.
Step 1 – Smart throttle on a fixed path (the speed-planning lever)
Voyage B vs. Voyage A isolates the value of speed planning on a fixed path. The vessel still follows the shortest-distance waypoints, but throttles back when conditions allow and speeds up when required, always arriving at the planned time.
Across 48 Atlantic crossings, Voyage B reduces energy consumption by about 7% on average compared with Voyage A. No new fuel, no new route – just a sensible throttle schedule tied to a planned arrival time.
Step 2 – Adding weather-aware route choice
We then allow EcoRouter to choose the route. In Voyage C, the vessel can deviate from the great-circle path into more favourable weather—typically around storms and into beneficial currents.
Comparing C against B, the speed-optimised reference, tells us the pure weather-routing premium: what you gain from being free to pick the path, on top of an already-smart throttle schedule. Across the eleven months, that premium averages 6.96%.

The chart shows a clear seasonal pattern. From October through March, Atlantic storm season, the weather-routing lever frequently lands in the 10-20% range. With two specific weeks where the optimal path saves more than a fifth of the voyage energy and several weeks where the savings are lower.
In summer, when weather disturbance is reduced, the same lever delivers smaller gains, as conditions are generally more favourable. The 6.96 % annual average therefore masks substantial variation, modest savings in calm summer weeks and much higher savings during stormy winter periods, rather than describing a typical week.
Step 3 – Both levers on, vs. no levers at all
Finally, Voyage C vs. Voyage A—the full prize. This represents the total saving available when moving from no optimisation to both speed and route optimised against weather conditions. Averaged across the 48 departures, the saving is 14.22%.

The two additional charts allow us to split the headline result. About half of the 14.22% comes from the speed-planning lever (~7 percentage points), the other half from weather-aware route choice (~7 percentage points).
These are two distinct operational levers, with broadly equal contributions on this route over the study period, combining to deliver the total saving. The split is approximate: changing the route also affects the optimal speed profile, so the levers are not fully independent. Even so, the conclusion holds for operators deciding where to invest.
What does this mean for operators?
Three things emerge from the experiment:
- The speed-planning lever requires the same inputs as weather routing – a Copernicus-grade forecast, a hydrodynamic model and an optimiser, but with one fewer degree of freedom: the route is fixed and only the speed schedule is optimised.
- Weather routing is not only beneficial for stormy seasons. Once smart throttle planning is already in place, route choice saves another 6.96% on average across the eleven months studied. Modest in calm summers and much larger in stormy winter weeks. On the right week the optimal path alone has the potential to save more than a fifth of the voyage energy.
- The two levers compound. The 14.22% total saving is what an operator running today’s “set the throttle and go” voyage stands to recover without switching to alternative fuels and without any hardware modifications to the ship. Only better decisions, made with the right weather forecast and the right tools.
Decarbonising shipping operations is not a single switch. It is a stack of operational levers, each earning its place. Eleven months of Atlantic data show that both speed planning and weather routing do.


Comments
No comments yet. Be the first to comment!