Skip to content

SINTEF Blog Gå til forsiden

  • Energy
  • Ocean
  • Digital
  • Health
  • Industry
  • Climate and environment
  • Building
  • Society
  • EN
  • NO
Energy Digital

Travel letter from the world’s warmest geothermal well. Part 2.

Geotermisk brønn i Italia. Her utføres måling av temperaturer nesten 3000m meter under bakken. Foto: SINTEF
authors
Magnus Hjelstuen
Research Manager
Morten Hamremoen Røed
Research Scientist
Published: 18. Dec 2017 | Last edited: 14. Apr 2025
2 min. reading
Comments (0)

A while back we wrote a letter from the worlds hottest geothermal well. Back then we were close to measuring  supercritical conditions (temperature above 374 °C and pressure above 220 bar) with our logging tool.

  • Read more about the Project in this article: Going for a geothermal world record

Another attempt

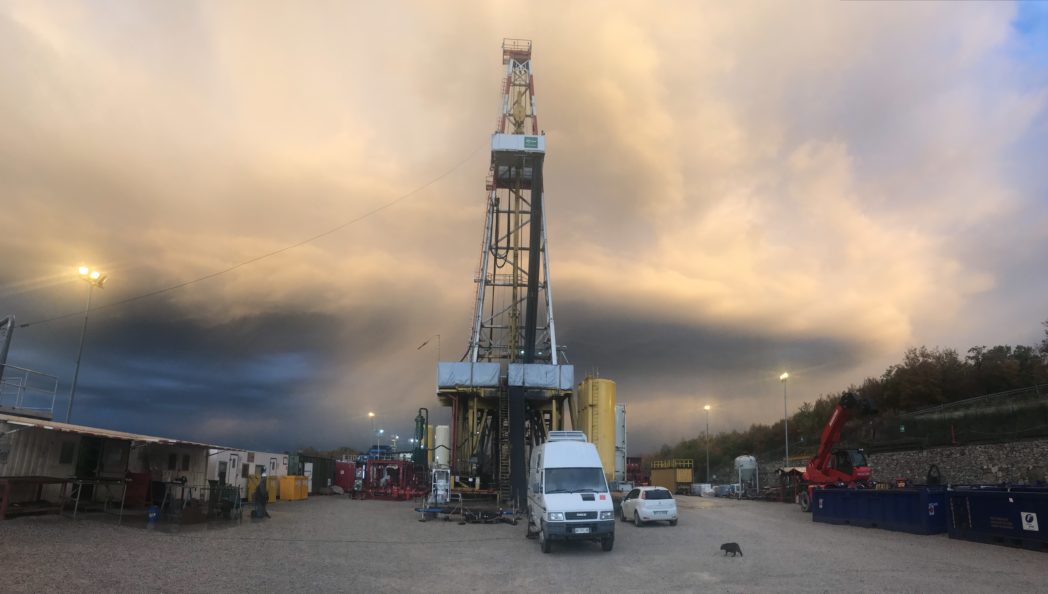
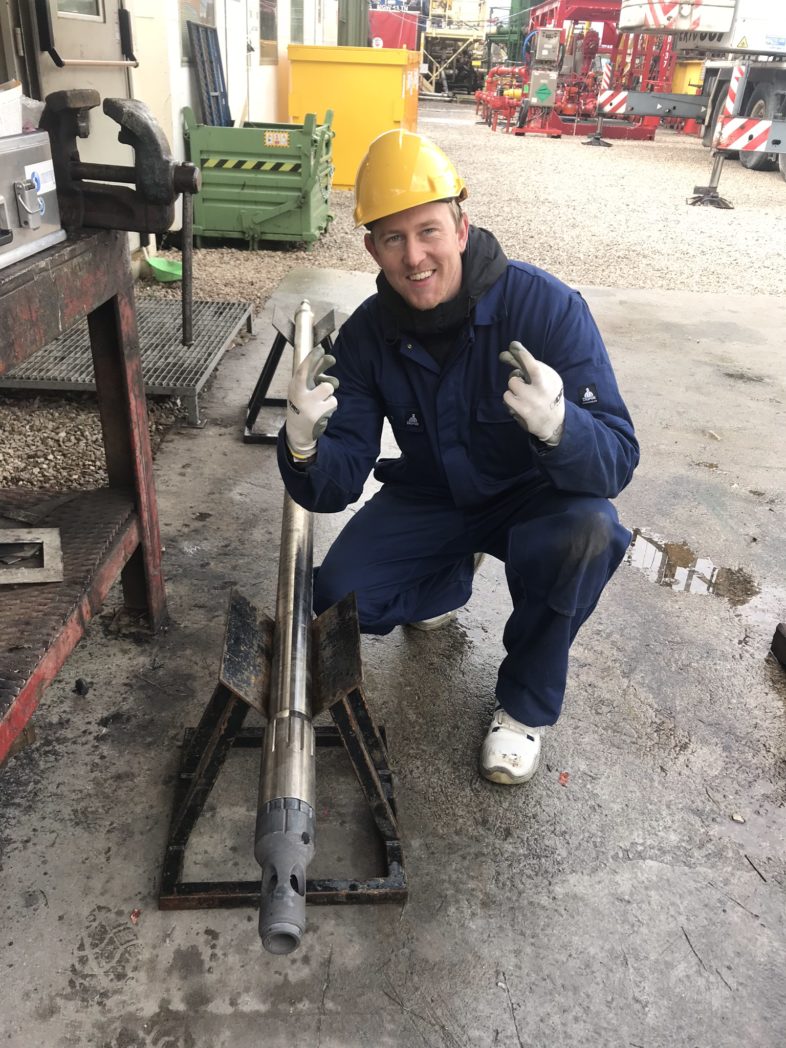
On the 28th of November we went back to the well for another attempt. This time it went very well, and on Friday, 1st of December, the PT (pressure and temperature) logging instrument SINTEF has designed in the H2020 project DESCRAMBLE measured a temperature of 443.6 °C in the well.

This is a new world record for electronic logging tools for geothermal wells.

SINTEF researcher Morten Røed is very happy with the world record. Here i is keeping his fingers crossed before lowering the logging tool into the well. Photo: SINTEF
SINTEF researcher Morten Røed is very happy with the world record. Here he is keeping his fingers crossed before lowering the logging tool into the well. Photo: SINTEF

The well is drilled by ENEL Green Power in the DESCRAMBLE project. The depth this temperature was measured at was 2810 m and the well has a total depth of 2900 m.

The project has now reached the goal of demonstrating drilling of a supercritical well and will end in December. In March 2018 the project will have a final conference in Pisa

Follow #SINTEFblogg – we will report from Pisa when we are there 🙂

Magnus Hjelstuen and Morten Røed
SINTEF Digital – Smart Sensor Systems

Comments

No comments yet. Be the first to comment!

Leave a comment Cancel reply

Your email address will not be published. Required fields are marked *

More about Energy

How much can energy-efficient voyage planning save? Evidence from 11 months of North Atlantic data

Author Image
Author Image
2 forfattere
Infographic showing the flow of thermal energy storage (TES) from surplus heat or cold to end users. On the left, red and blue thermometer icons represent surplus heat and cooling, accompanied by the text “Surplus heat or cold – Captured and stored for when it’s needed.” In the centre, a large panel titled “Thermal Energy Storage (TES)” presents three storage technologies. The top section, “Sensible TES,” shows a container with a thermometer and the text “Stores heat in one single phase.” The middle section, “Latent TES,” shows a water droplet and snowflake connected by circular arrows, with the text “Stores heat through phase change.” The bottom section, “Thermochemical TES,” shows two connected coloured circles that separate and reconnect, illustrating a reversible reaction, with the text “Stores heat through reversible reactions.” A large pale arrow-shaped wedge points from the TES panel toward the right side of the figure. On the right, three application areas are shown in separate boxes with icons: industrial processes, buildings, and data centres. The layout conveys that surplus heat or cold can be stored using sensible, latent, or thermochemical TES technologies and later supplied to industrial facilities, buildings, and data centres.

Thermal energy storage is already commercial  

Jorge Salgado Beceiro
Research Manager

Burning ammonia cleanly: How timing changes everything 

Author Image
Author Image
2 forfattere

Technology for a better society

  • About this blog
  • How to write a science blog
  • Sign up for our newsletter
  • News from NTNU and SINTEF
  • Facebook
Gå til SINTEF.no
SINTEF logo
© 2026 SINTEF Foundation
Privacy Editorial Press contacts Website by Headspin