Skip to content

SINTEF Blog Gå til forsiden

  • Energy
  • Ocean
  • Digital
  • Health
  • Industry
  • Climate and environment
  • Building
  • Society
  • EN
  • NO
Energy

CINELDI pilot projects, PhDs, deliverables and milestones are well under way

author
Gerd Kjølle
Chief Scientist
Published: 14. Jun 2018 | Last edited: 14. Apr 2025
3 min. reading
Comments (0)

FME CINELDI is just about half way through their second year of operations. The level of activities has been high thus far in the Centre’s short life, and the first tertiary report (Jan-Apr) of 2018 shows a lot of activity.

CINELDI pilot projects

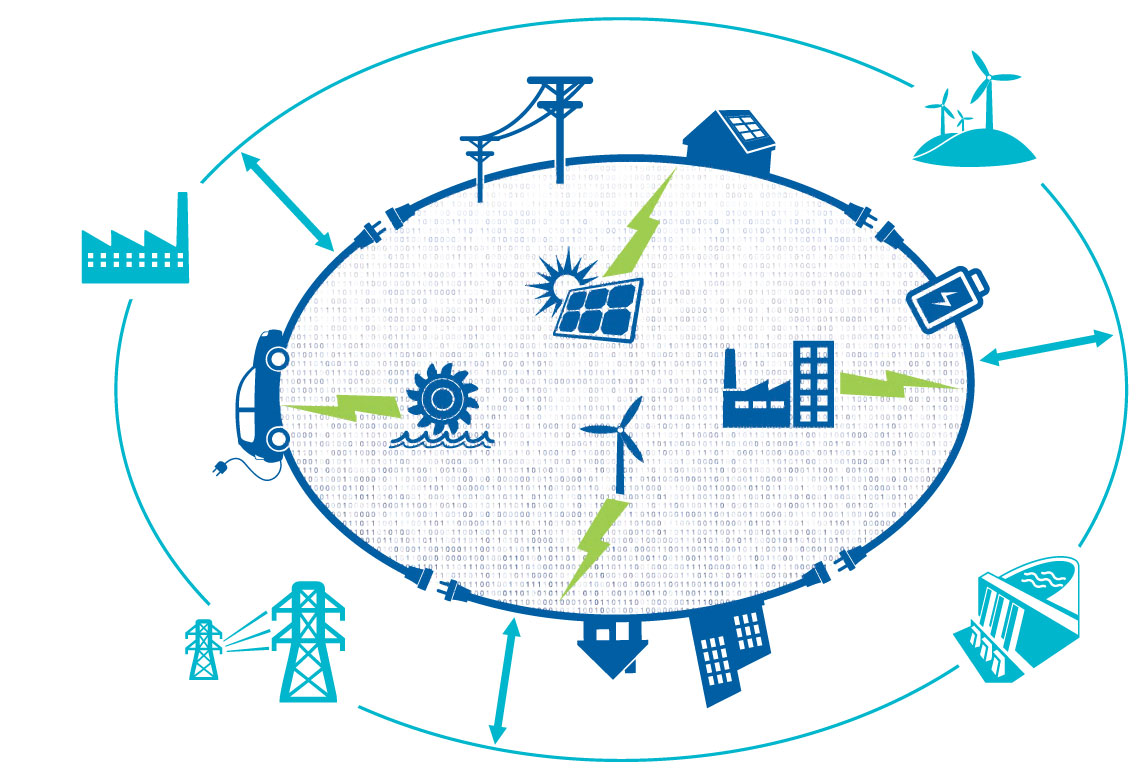
The objective of pilot projects in CINELDI is “to test and verify technologies and solutions for the future intelligent electricity distribution, in real environments and to contribute to innovation on the system level of the future electricity distribution.”

A lot of important work has been done towards pilot projects in this reporting period. To name a few, a Smart cable guard for detecting partial discharges in cables has been installed on 6 cable runs in Hafslund’s grid, the first successful test of a new protection scheme and fault localization has been performed in the Smart Grid Lab, and plans for pilot project(s) on digital substations are under development.


All work packages (WP) are delivering satisfying results

The first 2018 tertiary report shows that master and PhD/PD projects are on track in all WPs. Most PhDs/PDs have also attended a communication course to enhance their oral and written communication skills.

Deliverables are being produced at a satisfying rate, and several milestones have been reached in the reporting period. For example, a survey on the utilization of flexible resources in power system operation has been completed in WP3. In WP6, mini scenarios have been adapted and sorted, as well at dimensions spanning the opportunity set for the main scenarios (2040) have been identified.

User partner and industry involvement has been high in the reporting period through numerous workshops and skype meetings. Some of the WPs have also had their first expert group meetings.

We are also pleased that we have been more visible towards the public this tertiary, than we have before. Our first annual report was published in March, and a great effort was made to distribute it as widely as possible. We have also produced several popular science blogs, both from our researchers and a master student. WP4 has also written a conference publication “Prony’s method as a tool for power system identification in Smart Grids”. This was the work of MSc-students and has importance in assessing dynamics in non-linear systems as microgrids with power electric converters. PhD-students will continue the approach.

For detailed information, see the web page for each Work Package

  • WP1: Smart grid development and asset management
  • WP2: Smart grid operation
  • WP3: Interaction DSO/TSO
  • WP4: Microgrids
  • WP5: Flexible resources in the power system
  • WP6: Smart grid scenarios and transition strategies

Comments

No comments yet. Be the first to comment!

Leave a comment Cancel reply

Your email address will not be published. Required fields are marked *

More about Energy

How much can energy-efficient voyage planning save? Evidence from 11 months of North Atlantic data

Author Image
Author Image
2 forfattere
Infographic showing the flow of thermal energy storage (TES) from surplus heat or cold to end users. On the left, red and blue thermometer icons represent surplus heat and cooling, accompanied by the text “Surplus heat or cold – Captured and stored for when it’s needed.” In the centre, a large panel titled “Thermal Energy Storage (TES)” presents three storage technologies. The top section, “Sensible TES,” shows a container with a thermometer and the text “Stores heat in one single phase.” The middle section, “Latent TES,” shows a water droplet and snowflake connected by circular arrows, with the text “Stores heat through phase change.” The bottom section, “Thermochemical TES,” shows two connected coloured circles that separate and reconnect, illustrating a reversible reaction, with the text “Stores heat through reversible reactions.” A large pale arrow-shaped wedge points from the TES panel toward the right side of the figure. On the right, three application areas are shown in separate boxes with icons: industrial processes, buildings, and data centres. The layout conveys that surplus heat or cold can be stored using sensible, latent, or thermochemical TES technologies and later supplied to industrial facilities, buildings, and data centres.

Thermal energy storage is already commercial  

Jorge Salgado Beceiro
Research Manager

Burning ammonia cleanly: How timing changes everything 

Author Image
Author Image
2 forfattere

Technology for a better society

  • About this blog
  • How to write a science blog
  • Sign up for our newsletter
  • News from NTNU and SINTEF
  • Facebook
Gå til SINTEF.no
SINTEF logo
© 2026 SINTEF Foundation
Privacy Editorial Press contacts Website by Headspin