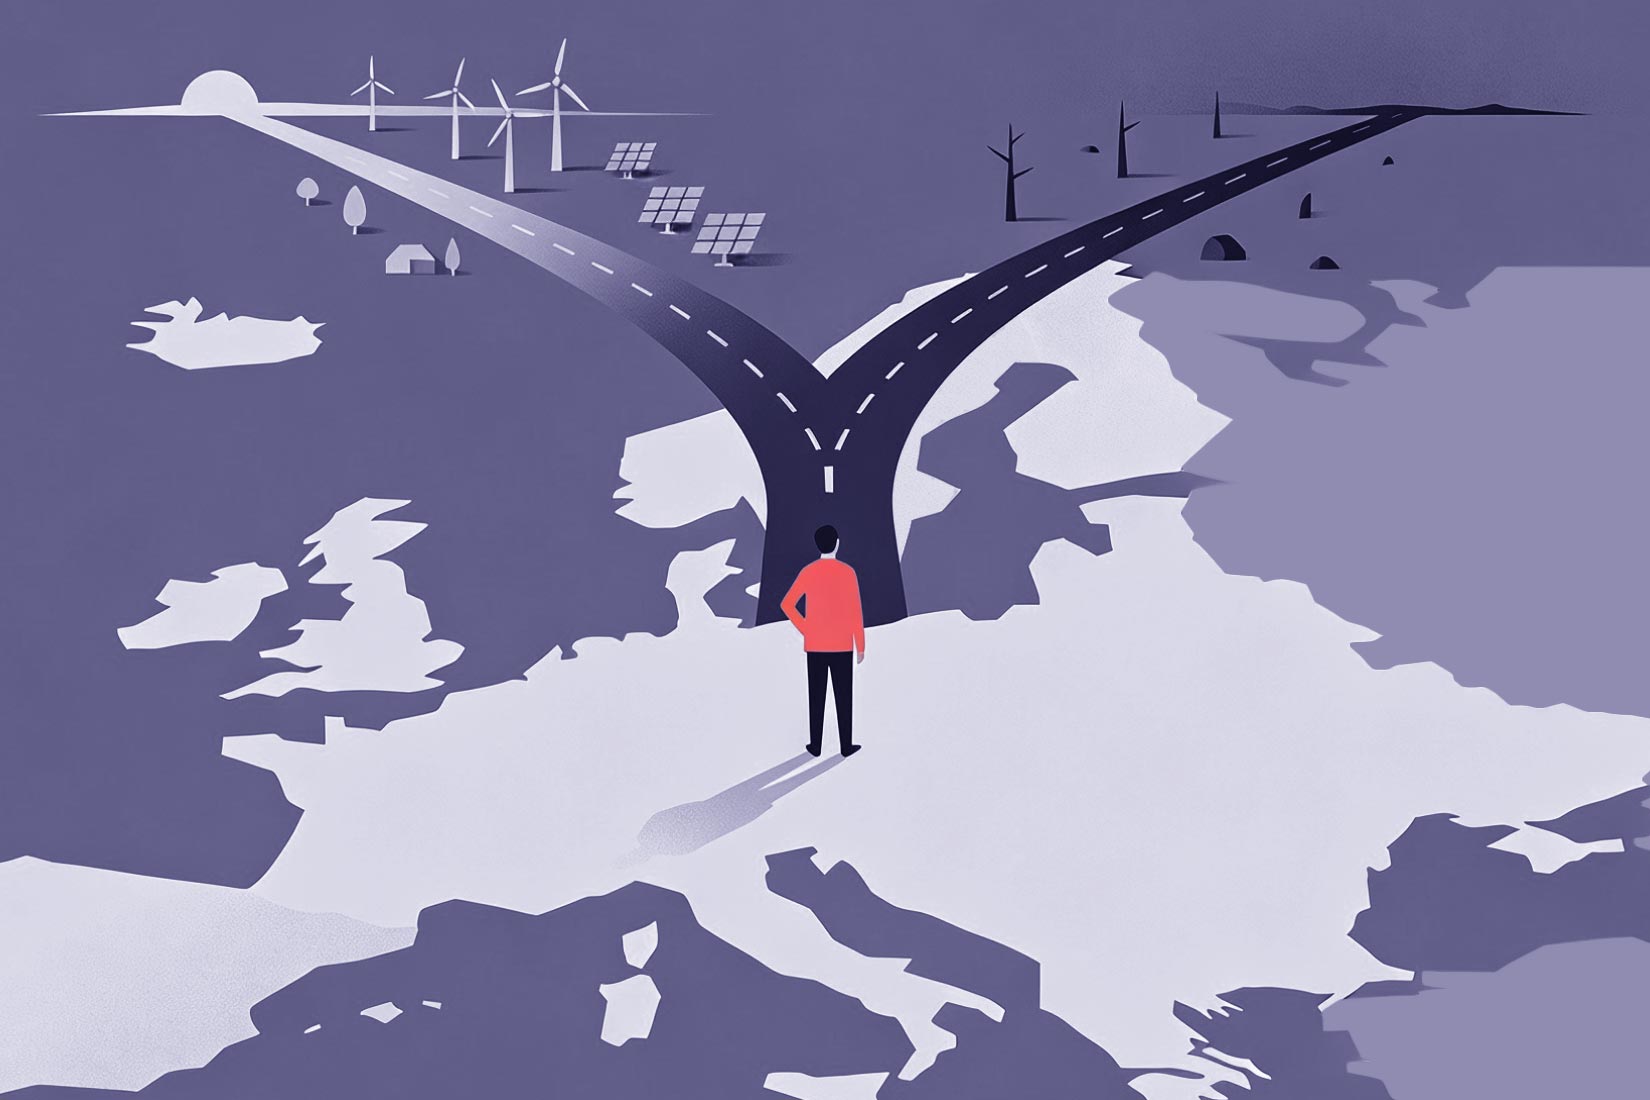


To reach its climate targets, the European Commission requests every member state to write a National Energy and Climate Plan, or NECP. Each plan describes how that particular country intends to cut emissions, build renewables, and secure its energy supply.
There is an obvious logic to this. Energy policy is deeply national: countries have different resources, industries, and political priorities. But there is also an obvious problem. Electricity does not stop at borders. Neither do gas pipelines, hydrogen networks, or the wind. When 27 countries each optimise for themselves, nobody is optimising for the system they all share.
This raises a question we wanted to answer with numbers rather than intuition: what does the sum of all these individual plans actually look like as a European energy system? And what would we gain, if anything, by planning together instead?
What is an NECP?
The National Energy and Climate Plans are ten-year plans that every EU country must submit, describing how it will contribute to the EU’s 2030 energy and climate targets, and ultimately to climate neutrality by 2050. The first round was submitted at the end of 2019, with updates due in 2024. An EU-wide assessment of the 2024 draft updates found that the combined plans are close to, but do not reach the binding targets.
Testing futures before they happen
You cannot run an experiment on the European energy system. What you can do is build a mathematical model of it and run the experiment there.
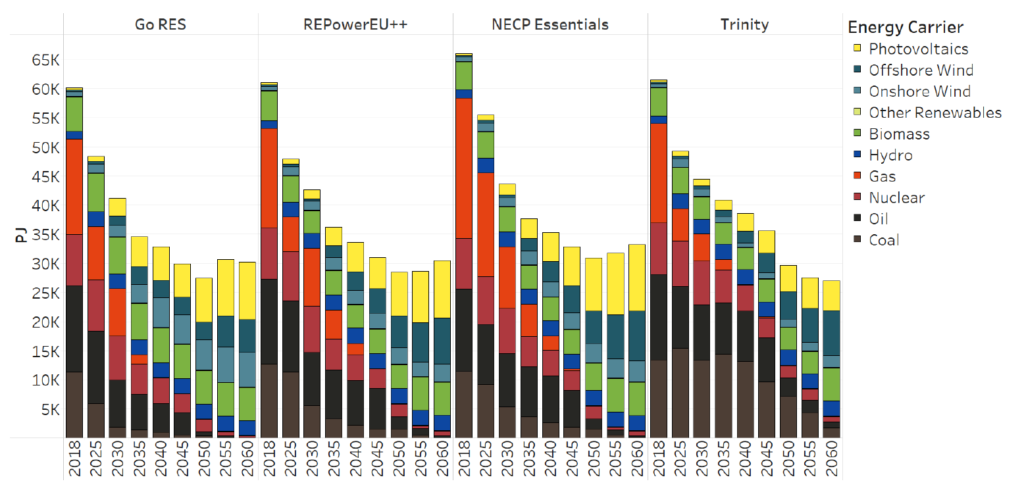
In the Man0EUvRE and iDesignRES projects, we developed four scenarios for Europe’s energy future up to 2060, together called the European Energy Vision 2060 (EU EnVis-2060). Each scenario is a coherent story about how society, technology, and geopolitics might develop, which we then translated into numbers and fed into an energy system model covering 30 European regions.
What is an energy system model?
An energy system model is a computer program that represents an entire energy system: power plants, heating, industry, transport, and the connections between them. Given a set of assumptions (technology costs, energy demand, emission limits), it calculates the cheapest combination of investments that satisfies them, choosing from over 160 technologies. Our study used GENeSYS-MOD, an open-source model whose code and data are publicly available.
Four possible futures for Europe
The four scenarios span a wide range of futures:
- EU Trinity is the pessimistic case: public indifference, slow innovation, geopolitical instability, and fragmented national policies. Europe misses its net-zero goal.
- NECP Essentials is the “current plans” case. It follows the NECPs with their existing measures, extended to 2060 with minimal additional effort. This is the scenario that represents each country planning for itself.
- REPowerEU++ is a united Europe under pressure: geopolitical tensions escalate, but the EU responds with cooperation, strong public support, and rapid technological progress.
- Go RES is the idealistic case: a fully decarbonised system, stable geopolitics, global cooperation, and a transition compatible with limiting warming to 1.5 °C.
Comparing NECP Essentials with REPowerEU++ is where it gets interesting. These two scenarios operate under the same carbon budget. The main difference between them is the mindset: individualistic versus unified.
The gap that grows over time
Looking at total system costs over the whole period from 2018 to 2060, the scenarios seem surprisingly close: the individualistic NECP Essentials future costs only about one percent more than the cooperative REPowerEU++ future.
But this average hides what is really going on. The early years of any transition look similar because the big investments are still being made. The differences show up later, when those investments start to pay off, or fail to.
By 2060, the picture is much starker. Taking the cheapest scenario (Go RES) as the baseline, the annual energy system cost in 2060 is about 12% higher in the cooperative REPowerEU++ future, 25% higher in the individualistic NECP Essentials future, and 40% higher in the pessimistic EU Trinity future.
In other words: the current national plans do deliver a transition, but a more expensive one than necessary. And the cost of that fragmentation compounds over time.
Cheaper, and more industrious
Cost is not the only difference. One might expect the cheaper, cooperative future to be one of restraint and reduced activity. The model suggests the opposite.
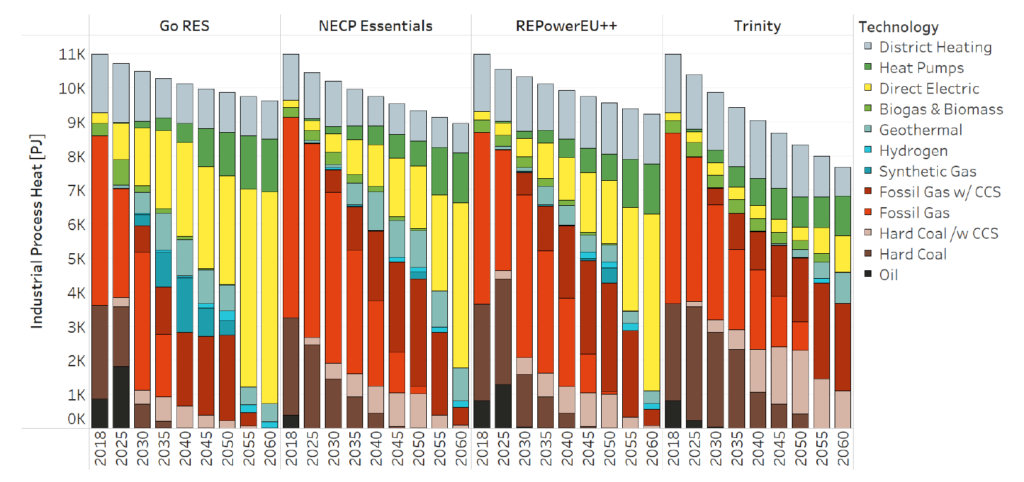
In the unified REPowerEU++ scenario, industry is more electrified and industrial process heat generation is slightly higher than in NECP Essentials. Both futures get roughly two-thirds of their primary energy from variable renewables by the end of the period. But the cooperative one achieves this with lower primary energy consumption overall, thanks to a greater willingness to adopt new technologies and energy conservation measures, for example in building heating.
Meanwhile, the pessimistic EU Trinity scenario shows what fragmentation looks like at its worst: the most expensive energy system of all four futures, combined with the steepest decline in industrial activity. In this scenario, less coordination correlates with less electrification, less industrial output, and a heavier reliance on district heating to cover the resulting heat demand.
What this means for the next round of plans
Scenarios are not predictions, and our emission budgets are calculated over the whole period, allowing the model to compensate for early emissions with net negative emissions later.
But the central finding is robust across the futures we tested: there is real, measurable value in a unified European energy transition. Cooperation among member states means a cheaper energy system and more industrial activity than an individualistic approach, even under identical climate ambitions.
The NECPs are updated regularly, and each update is an opportunity. A deeper knowledge of your neighbouring countries’ energy situation and policies is not just diplomatic courtesy. It is, quite literally, a way to make your own plan better.
This work is based on the paper “Energy and climate plans in energy system modelling scenarios“, presented at the 21st International Conference on the European Energy Market (EEM 2025).
The project ‘Man0EUvRE – Energy System Modelling for Transition to a net-Zero 2050 for EU via REPowerEU’ is funded by CETPartnership, the European Partnership under Joint Call 2022 for research proposals, co-funded by the European Commission (GA N°101069750) and with the funding organisations listed on the CETPartnership website.







Comments
No comments yet. Be the first to comment!