


Since 2015, SINTEF Energy Research has been leading a research project named Predict-RPT. The main goal of this project has been to improve the understanding of the potentially dangerous LNG Rapid Phase Transition (RPT) event. Below we will summarize some of our recently published progress (Predicting triggering and consequence of delayed LNG RPT) regarding quantitative assessment of LNG RPT risk and consequence.
What are LNG RPT events?
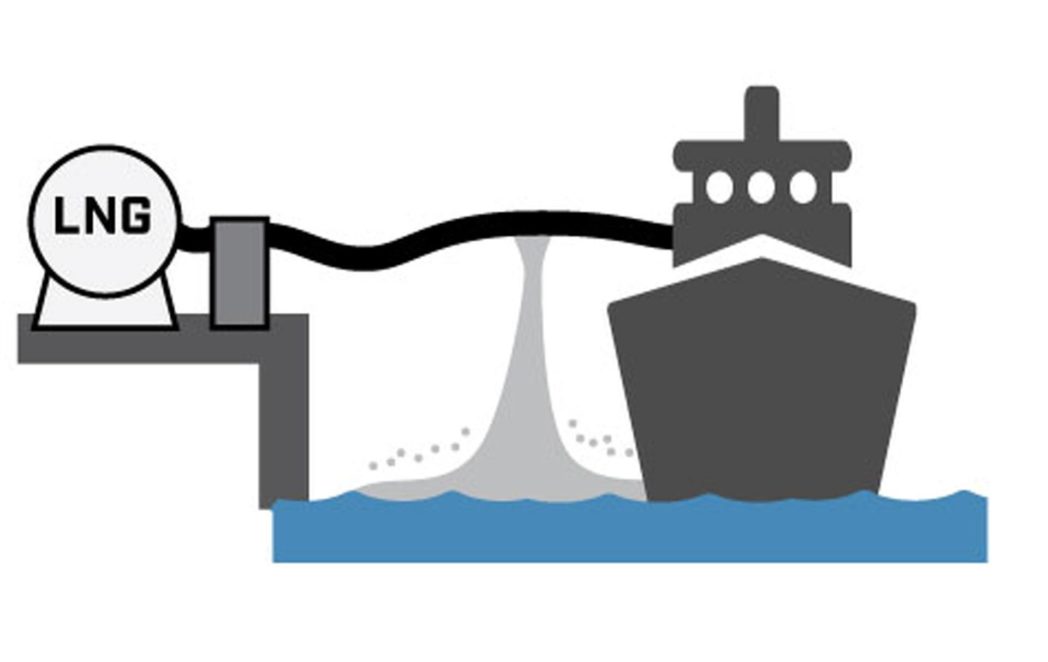
In marine LNG operations, either during production, transportation, or usage, there is a risk of spilling LNG onto water. As indicated in the sketch below, the LNG will start spreading on top of the ocean surface while evaporating. Although this often occurs without any further major incident, sometimes sudden explosive events occur. These are not explosions in the common sense, i.e. there is no fire. Rather, these events are so-called vapor explosions caused by abrupt and simultaneous evaporation of a larger amount of LNG.
For more information about the rapid phase transition, see the blog “Why LNG Rapid Phase Transitions occur (And 3 reasons why they deserve attention)“
Why do LNG RPT events occur?
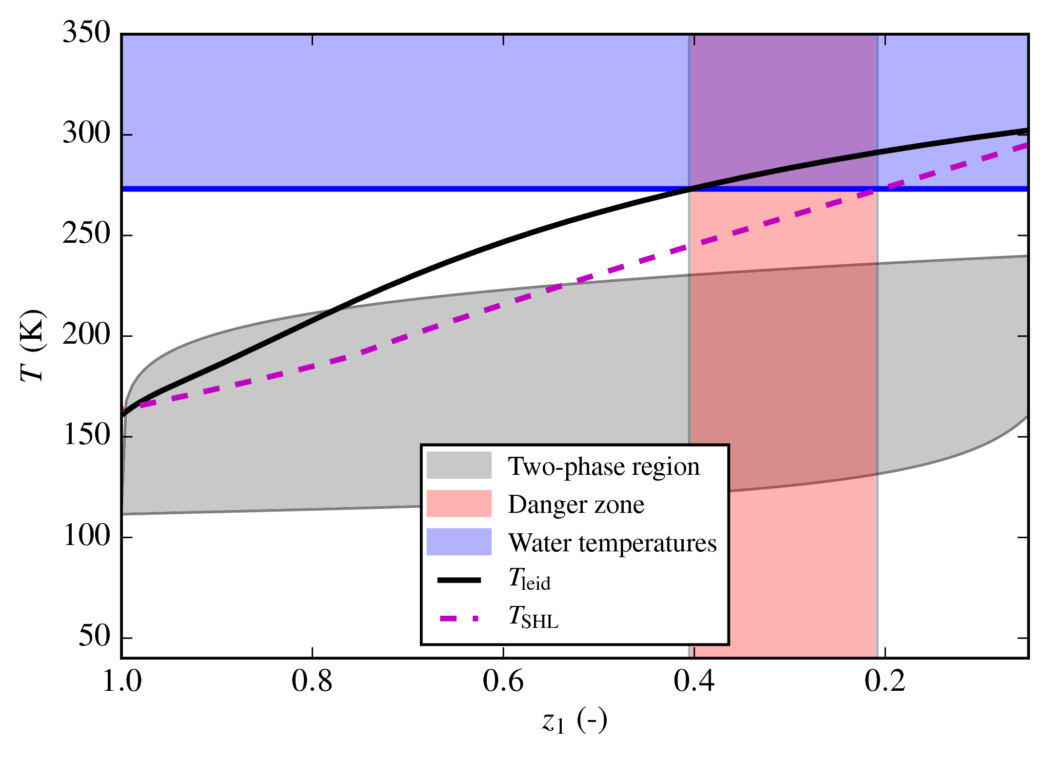
Since the LNG is very cold (-162℃) compared to seawater, the spill will initially be in the film-boiling regime. The resulting vapor film keeps the heat flux low, and no RPT event may occur. The commonly accepted theory is that RPT events are triggered because of a sudden breakdown of film boiling. As illustrated in the figure below, this occurs when the so-called Leidenfrost temperature of the LNG becomes high enough. The Leidenfrost temperature is initially too low for film boiling to break down, but if we note the following three points,
- RPT triggers when the LNG Leidenfrost temperature becomes high enough.
- The LNG Leidenfrost temperature increases as the fraction of methane decreases.
- The methane fraction in LNG decreases as it boils on top of water.
we see that the conditions for an RPT may be met if LNG is given enough time to boil off. In Predict-RPT we have developed a method to make quantitative predictions based on these principles, using thermodynamics and nucleation theory.

Predicting LNG RPT
With our method we attempt to answer the following questions:
- Can a given spilled LNG mixture reach the conditions for RPT?
- If yes to (1), how much LNG is left when those conditions are met, and what is the composition at that time?
- If yes to (1), how severe is the resulting explosive event when RPT occurs, given the composition at the time of triggering?
Our method allows the generation of an “RPT triggering-plot” in terms of decreasing methane fraction in the LNG, as shown below.
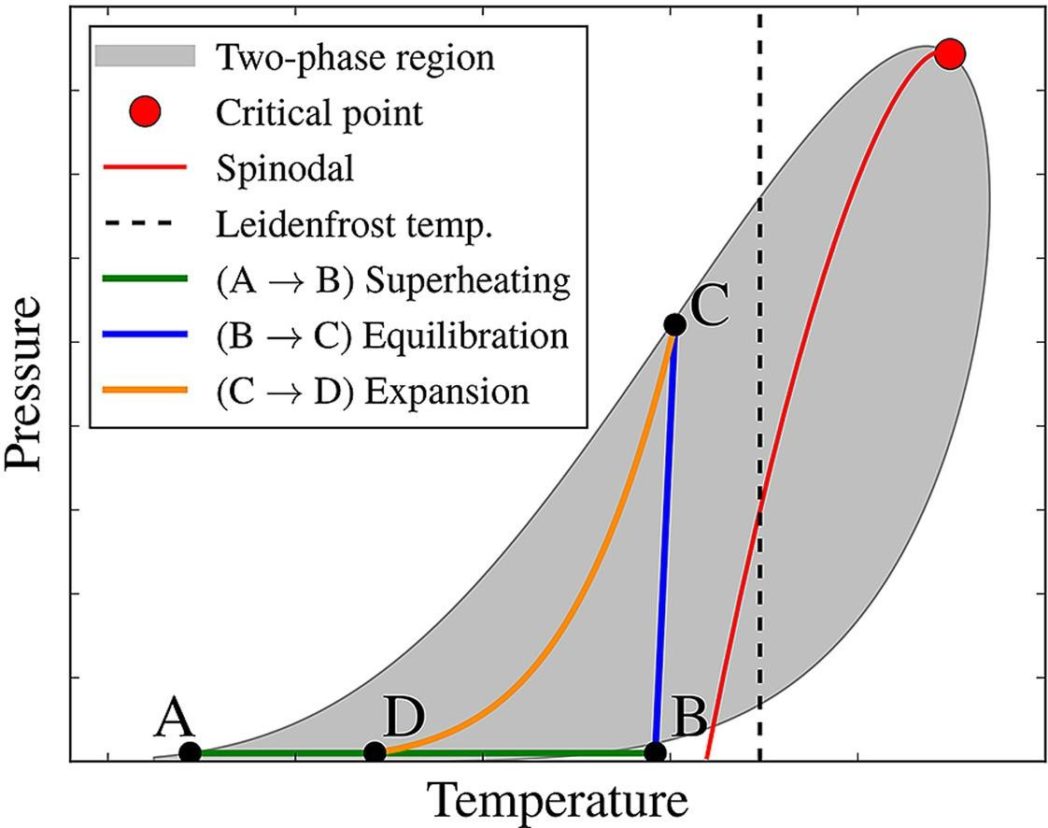
Based on the LNG composition at the time of predicted triggering, the explosive energy yield may be estimated based on a simplified thermodynamic process (Figure below).
The details behind the method may be found in our published article. The novelty of this work lies in combining and refining leading hypotheses from the literature regarding the mechanisms behind LNG rapid phase transition (RPT) into one consistent and comprehensive model. Based on this advanced model, we present brand new correlations which may be used by engineers in practical risk assessment without requiring access to, or detailed understanding of, the underlying thermodynamic algorithms.
Based on this method, we arrived at the following conclusions:
- Spilled LNG will typically boil down to about 10–20% of the original amount before delayed RPT is possible.
- The explosive yield may be up to 10-20 g TNT per kg triggered LNG, with peak pressures up to about 50 bar.
- To decrease risk of RPT, efforts should be made to maximize the fraction of methane and minimize the fractions of propane and butane in the LNG.
Efforts to couple these models into a large-scale spill simulator are underway.
Acknowledgements and academic source:
This blog entry is based on the recent academic paper “Predicting triggering and consequence of delayed LNG RPT” (https://doi.org/10.1016/j.jlp.2018.06.001) published in Journal of Loss Prevention in the Process Industries. This publication is based on results from the research project “Predicting the risk of rapid phase-transition events in LNG spills (Predict-RPT)”, performed under the MAROFF program. The authors acknowledge the Research Council of Norway (244076/O80) for support.


Comments
No comments yet. Be the first to comment!