Skip to content

SINTEF Blog Gå til forsiden

  • Energy
  • Ocean
  • Digital
  • Health
  • Industry
  • Climate and environment
  • Building
  • Society
  • EN
  • NO
Energy

ICOE – The International Conference on Ocean Energy (June 2018)

author
Hans Christian Bolstad
Senior Project Manager
Published: 6. Aug 2018 | Last edited: 14. Apr 2025
2 min. reading
Comments (0)

Members of the MegaRoller consortium participated in the The International Conference on Ocean Energy (ICOE) in Cherbourg, France from June 12-14th 2018.

The International Conference on Ocean Energy

The conference is a global marine energy event focused on the industrial development of renewable marine energy. Held every two years, the goal of the conference and exhibition is to share recent experiences from research and demonstration efforts. It aims to accelerate development by stimulating collaboration networks between companies and research and development centres.

The conference lasted for 2,5 days and had various technical and semi-commercial presentations in relation to wave- and tidal energy. In addition, there was a exhibition from international and French exhibitors.

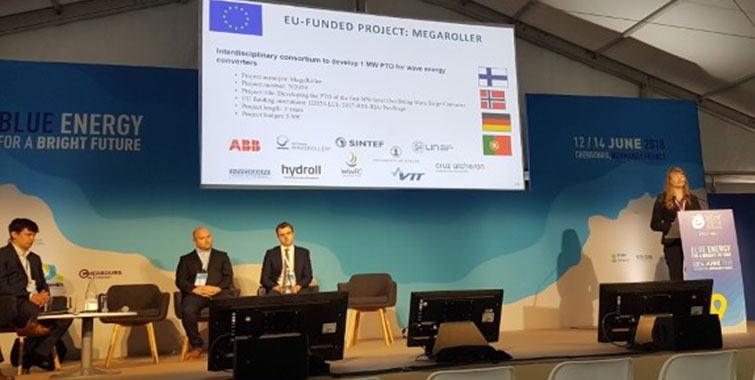
The MegaRoller project presented at ICOE

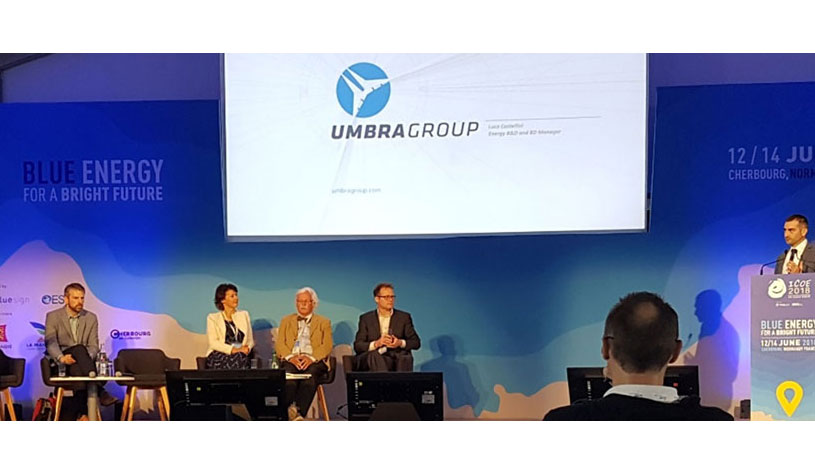
MegaRoller coordinator Tuula Mäki held a presentation on Tuesday 13th June. She of course used the opportunity to inform the industry and Wave Energy community about the newly launched MegaRoller project. The presentation by Tuula and representatives from 3 other flagship projects was followed by a very interesting panel debate. Well done, Tuula!

Tuula presenting at the ICOE 2018 in Cherbourg, France (Normandie).
Exhibition area
Right: Early morning overview of the poster area with the exhibition in the background.
Left: It takes concentration and preparations to be a presenter at an international conference!

The next conference in the ICOE series will be in Washington in 2020.

Comments

No comments yet. Be the first to comment!

Leave a comment Cancel reply

Your email address will not be published. Required fields are marked *

More about Energy

How much can energy-efficient voyage planning save? Evidence from 11 months of North Atlantic data

Author Image
Author Image
2 forfattere
Infographic showing the flow of thermal energy storage (TES) from surplus heat or cold to end users. On the left, red and blue thermometer icons represent surplus heat and cooling, accompanied by the text “Surplus heat or cold – Captured and stored for when it’s needed.” In the centre, a large panel titled “Thermal Energy Storage (TES)” presents three storage technologies. The top section, “Sensible TES,” shows a container with a thermometer and the text “Stores heat in one single phase.” The middle section, “Latent TES,” shows a water droplet and snowflake connected by circular arrows, with the text “Stores heat through phase change.” The bottom section, “Thermochemical TES,” shows two connected coloured circles that separate and reconnect, illustrating a reversible reaction, with the text “Stores heat through reversible reactions.” A large pale arrow-shaped wedge points from the TES panel toward the right side of the figure. On the right, three application areas are shown in separate boxes with icons: industrial processes, buildings, and data centres. The layout conveys that surplus heat or cold can be stored using sensible, latent, or thermochemical TES technologies and later supplied to industrial facilities, buildings, and data centres.

Thermal energy storage is already commercial  

Jorge Salgado Beceiro
Research Manager

Burning ammonia cleanly: How timing changes everything 

Author Image
Author Image
2 forfattere

Technology for a better society

  • About this blog
  • How to write a science blog
  • Sign up for our newsletter
  • News from NTNU and SINTEF
  • Facebook
Gå til SINTEF.no
SINTEF logo
© 2026 SINTEF Foundation
Privacy Editorial Press contacts Website by Headspin