Philipp Härtel from Fraunhofer IWES is visiting us at NOWITECH for 3 months under the IRPWind mobility program.
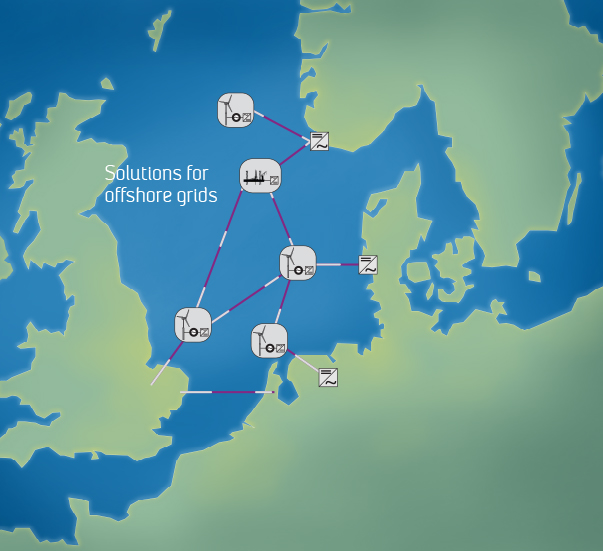
Offshore grids in the North Sea
The focus of his research is with methods and modelling approaches for assessing the impact of alternative flexibility options on offshore grid designs in the North Sea.
This research involves finding and implementing suitable transmission expansion planning (TEP) models for offshore grid investments. SINTEF Energy Research and NTNU will bring in experience from several national projects, in which offshore grid design concepts and scenarios have been defined and evaluated.
Among the research topics during his guest stay are:

- Developing suitable aggregated hydro power models for the application in transmission grid expansion planning/ unit commitment models
- Comparing cost models and parameters for offshore grid transmission technology options for the application in transmission grid expansion planning models
- Undertaking model comparison of two market-based offshore grid expansion planning models (i.e. SINTEF’s NetOp model and the TEP model developed at Fraunhofer IWES within the NSON-DE project)
- Discussing and aligning cost-benefit evaluation methodology for upcoming analyses in the NSON-DE project
We look forward to hearing more about the results from Philipp over the months to come.


Comments
No comments yet. Be the first to comment!