
Guest bloggers: Maria Apolonia and Teresa Simas , WaveEC
As technology evolves towards commercial scale, potential environmental impacts of wave energy deployments have been gaining more and more attention over the last years, from both developers and regulators. The fact that wave energy projects have unique characteristics, different from any other marine projects, results in a lack of methodological approaches for environmental and socio-economic impacts evaluation. Current existing levels of uncertainty in the sector pose a major problem to the accurate identification of key environmental effects and subsequent steps of an Environmental Impact Assessment (EIA), such as the elaboration of monitoring plans.
A risk-based approach has been often proposed to predict potential impacts in wave energy projects.
Firstly, integrating the term ‘key environmental effects’ in the EIA process
EIA is an environmental management instrument implemented worldwide that ensures that the environmental implications of a certain action are considered before decision making in a given project. In Europe, the majority of MRE developments require EIA. Small scale demonstration projects may not require carrying out a full EIA however commercial scale deployments are expected to be subject to an entire assessment. The need to identify key effects arises in the scoping phase, after being decided an EIA is required during screening stage.
Going through scoping stage towards a monitoring plan
The scoping stage identifies the environmental and socioeconomic effects that are likely to be of most importance during the EIA so that the study focuses on the significant aspects and avoids time consuming activities.
Firstly, a baseline characterization is carried out to give information about the reference conditions of the site where the project will take place, on an environmental and socioeconomic level. It will be the basis to predict potential impacts.
The identification and prediction of key effects will then set the scene for the delineation of mitigation measures which refers to methods of action that need to be taken to prevent, minimize and compensate for the predicted adverse effects of the project or to enhance its positive effects. Finally, a monitoring plan should be drawn to assess each potential effect and mitigation measures’ effectiveness. Plans should be designed to measure changes against baseline conditions or management objectives. It is a key step to validate and change initial EIA findings through the adoption of a risk-based approach – we’ll get into this later on.
How to identify potential impacts?
Now that a brief context of the EIA process was given, let’s go back some steps to scoping phase and describe the risk-based approach that has been widely proposed in recent years. It is based on the relationship between stressors and receptors and resulting key environmental and socioeconomic effects.
What is a stressor?
A stressor refers to any single characteristic or activity of an ocean energy project. This can include vessel activity during construction or physical presence of the device during operation.
And what about a receptor?
A receptor is described as any ecosystem element with potential for some form of response to the stressor[1]. Water column and marine mammals are examples of considered receptors.
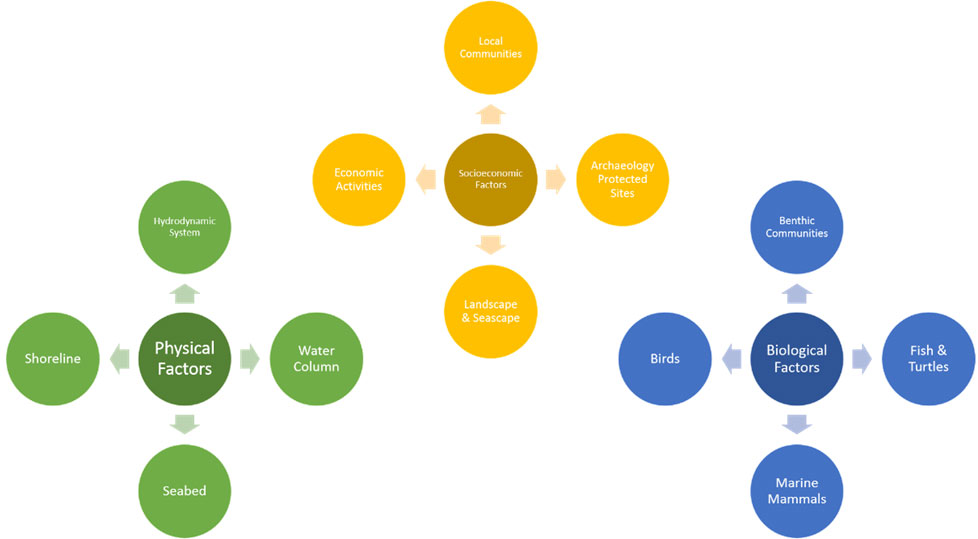
Figure 1 – Examples of physical, biological and socioeconomic receptors.
For each development phase (preparation to decommissioning) these interactions, or potential key effects, are identified and quantified based on experience related with similar projects or simply based on expert knowledge regarding the sensitivity of the site and project characteristics.
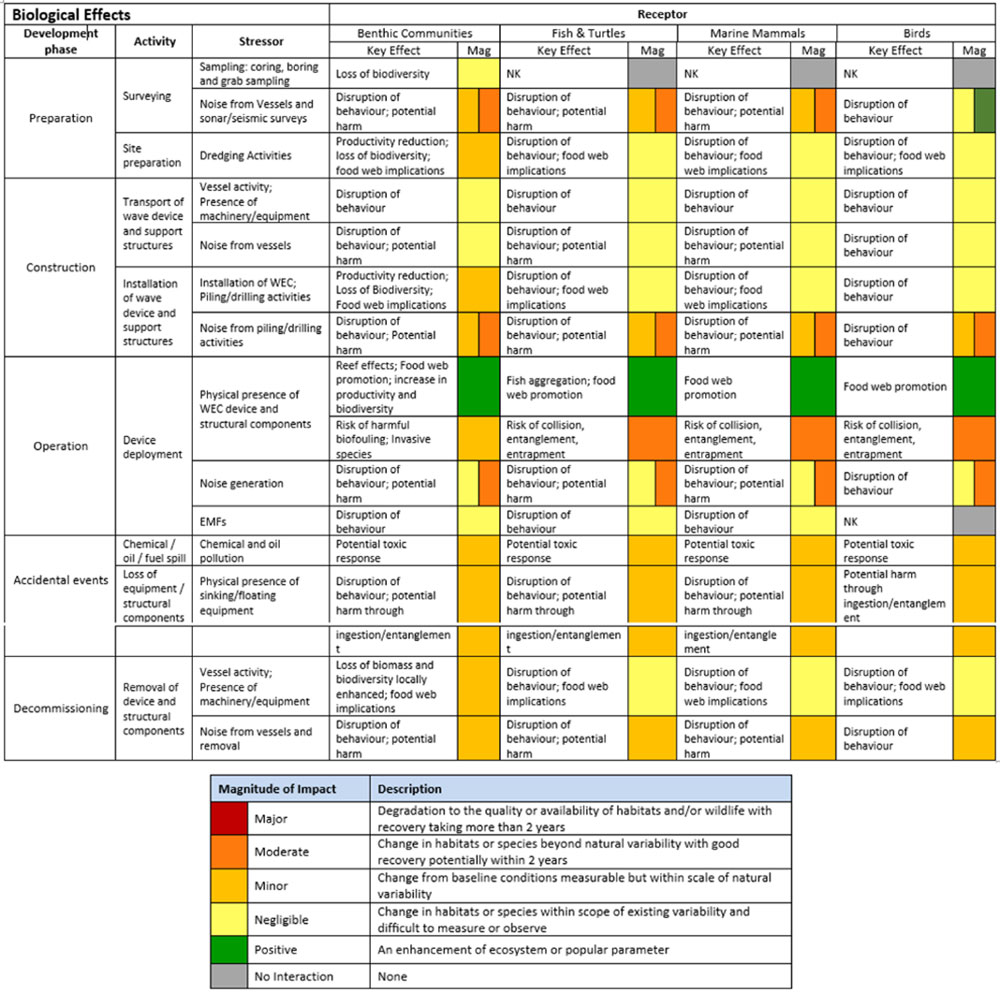
In other words, a key environmental effect is the result of the interaction between a receptor and a stressor.
The result of this exercise is an impact matrix similar to the one shown below. These key effects are then evaluated through a ranking classification criterion (the one shown in the example was adapted from EMEC guidelines). Such an approach allows for the developer to get the ‘big picture’ of all the potential impacts across all development phases and to choose which ones to focus the mitigation measures on.
When should Adaptive Management approach be implemented?
The analysis of each matrix should be followed by the selection on the most relevant key effects through the adoption of a risk-based approach.
Why?
Well, very often information on potential effects identification and quantification is not available and thus the decision-making on approving a project needs to be risk based relying on the implementation of mitigation measures and on the results of monitoring activities. An Adaptive Management (AM) approach should therefore be applied to manage project impacts in terms of mitigation measures’ adaptation and monitoring plan review.
AM is an iterative process that promotes decision-making, which can be adjusted in the face of uncertainties as outcomes from management and other events become better understood.
In other words, AM is a ‘learn by doing’ approach in which key effects are periodically assessed, allowing mitigation measures and monitoring plans to be continuously adapted considering new data inputs. It has been widely used in some countries such as Denmark and the United States.
Megaroller
As part of MegaRoller Project, WavEC’s team of Marine Environment and Public Policies is currently developing an EIA public tool to help users decide on best monitoring techniques using the stressor-receptor matrix described above.
The tool is currently focused on nearshore wave energy devices, but it is expected to be adapted to offshore wave energy as well as tidal energy projects.
To learn more, the WavEC website.
[1] Iglesias, G., J.A. Tercero, T. Simas, I. Machado, and E. Cruz. 2018. “Environmental Effects.” In Wave and Tidal Energy.


Comments
No comments yet. Be the first to comment!