Skip to content

SINTEF Blog Gå til forsiden

  • Energy
  • Ocean
  • Digital
  • Health
  • Industry
  • Climate and environment
  • Building
  • Society
  • EN
  • NO
Energy Society

Using home area network to extract information about the grid

author
SINTEF
Published: 16. May 2018 | Last edited: 14. Apr 2025
3 min. reading
Comments (2)

Guest blogger: Erlend Grande, Master student, Department of Engineering Cybernetics, NTNU

Erlend Grande, a CINELDI master student, is working on a thesis titled “Data gathering and -assembling from several smart meter HAN ports” is in progress.

  • CINELDI’s 1st annual report is now ready and can be found here

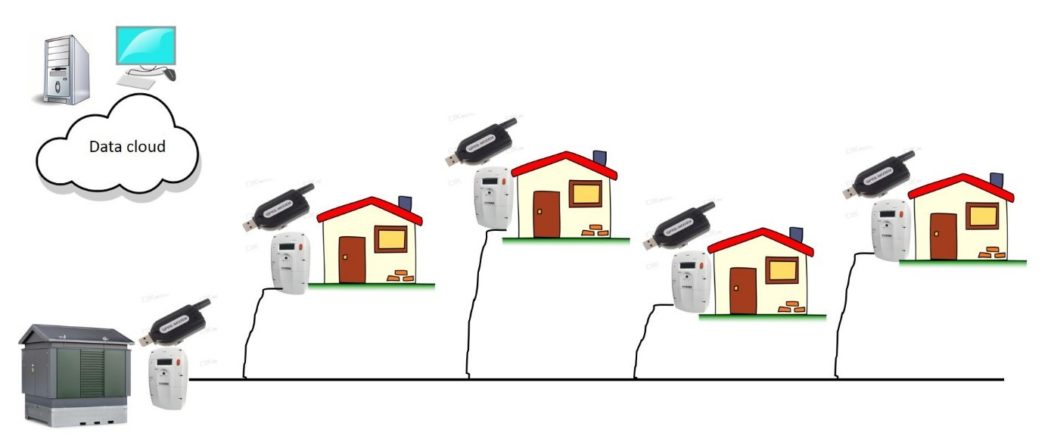
This system will make an efficient system for collecting real-time data from the HAN (home area network) port of distributed smart meters. The information is then transferred to a cloud service for a preliminary analysis of the assembled data.

  • This master thesis is a part of research centre CINELDI

Smart meter neighborhoods

Normally, the real-time data from the smart meters are used for analyzing the in-house consumption and for in-house energy management systems. However, by analyzing real-time data from several smart meters in a neighborhood, information about the condition of the outdoor connecting grid can be extracted.

As the smart meters are installed in the grid already due to fiscal reasons, these measurements are “nearly free”.

The real-time data from the smart meters can reveal if there is an irregular mismatch between energy from the transformer station and the sum of energy floating in or out of the houses.

Further, the measurements will tell how the voltage varies along the line. This is especially of interest for long lines with prosumers connected to the grid. Depending on which measurements are available on the HAN port on real-time basis, other superior information can be extracted from the sketched system, to the benefit of the utility company


Transformer station with connected houses, all with smart meters transferring real-time data via modems to a cloud service for analyses.

Master thesis focus

The master thesis focuses on the embedded system enabling the real-time data gathering and -assembling from the HAN ports. The described analysis will be implemented just to illustrate the use of the system. Currently, most of the bricks forming a complete system are developed and demonstrated:

  • A tiny embedded system for reading the output of the HAN port and interpreting the data.
  • A 4G connection to a cloud service for data transfer using existing tele-communication infrastructure.
  • A simple graphical user interface for displaying the voltage as a function of location along the line

The remaining work will consist of stitching together the modules, duplicating the equipment and then test the system in real environment, i.e. in a real grid with measurements from all smart meters on a power line from a transformer station.


Comments

No comments yet. Be the first to comment!

Leave a comment Cancel reply

Your email address will not be published. Required fields are marked *

More about Energy

How much can energy-efficient voyage planning save? Evidence from 11 months of North Atlantic data

Author Image
Author Image
2 forfattere
Infographic showing the flow of thermal energy storage (TES) from surplus heat or cold to end users. On the left, red and blue thermometer icons represent surplus heat and cooling, accompanied by the text “Surplus heat or cold – Captured and stored for when it’s needed.” In the centre, a large panel titled “Thermal Energy Storage (TES)” presents three storage technologies. The top section, “Sensible TES,” shows a container with a thermometer and the text “Stores heat in one single phase.” The middle section, “Latent TES,” shows a water droplet and snowflake connected by circular arrows, with the text “Stores heat through phase change.” The bottom section, “Thermochemical TES,” shows two connected coloured circles that separate and reconnect, illustrating a reversible reaction, with the text “Stores heat through reversible reactions.” A large pale arrow-shaped wedge points from the TES panel toward the right side of the figure. On the right, three application areas are shown in separate boxes with icons: industrial processes, buildings, and data centres. The layout conveys that surplus heat or cold can be stored using sensible, latent, or thermochemical TES technologies and later supplied to industrial facilities, buildings, and data centres.

Thermal energy storage is already commercial  

Jorge Salgado Beceiro
Research Manager

Burning ammonia cleanly: How timing changes everything 

Author Image
Author Image
2 forfattere

Technology for a better society

  • About this blog
  • How to write a science blog
  • Sign up for our newsletter
  • News from NTNU and SINTEF
  • Facebook
Gå til SINTEF.no
SINTEF logo
© 2026 SINTEF Foundation
Privacy Editorial Press contacts Website by Headspin