

SINTEF are measuring and analysing Greenhouse Gas emissions in hydropower systems all over the world to provide producers with specific, scientifically based emission rates for use in sustainability reporting.
Climate accounting for hydropower plants
Operation related emissions will typically be the most significant source in the climate accounting for hydropower systems. Therefore, it is important to have reliable and detailed data to report accurately and to set goals for lower emissions.
To create a climate inventory, we must consider the entire natural carbon cycle within the system.
We determine emissions with and without the flooded areas and use this to establish a net climate accounting
With this data on greenhouse gas emissions, companies gain a solid foundation for both external reporting and internal management. Our measurements can be integrated into a variety of international frameworks for climate and sustainability reporting, including the GHG Protocol, the EU Taxonomy, CSRD, as well as national and regional requirements in e.g. Africa, Asia, and America.
How does hydropower affect the carbon cycle in reservoirs?
Flooding areas for hydropower reservoirs can alter the balance of the natural carbon cycle. This affects the local climate and physical environment within the catchment area.
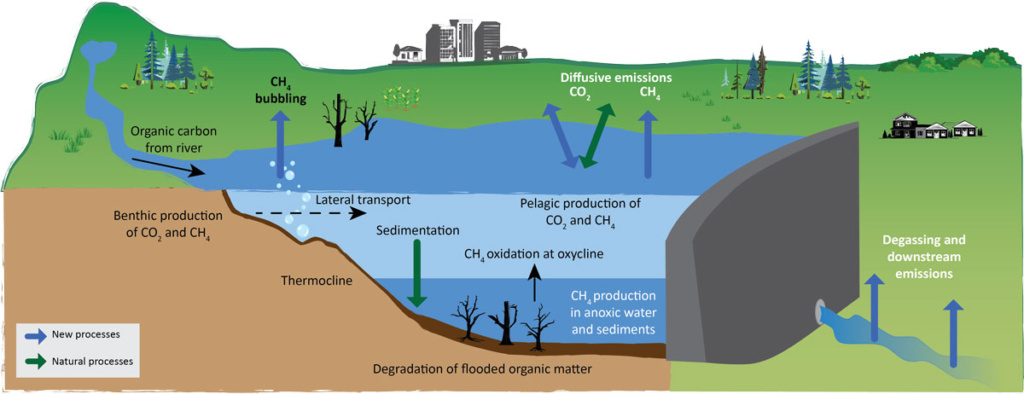
Whether hydropower reservoirs contribute to increased greenhouse gas emissions—and if so, by how much—varies greatly from region to region, depending on factors such as vegetation and climate, hydropower operation and the physical properties of the reservoir
We work in different countries, such as Laos…
… Zambia…
… and Albania, to name a few.
In many parts of the world, CO₂ and methane emissions from hydropower reservoirs are not a major problem.
It is nevertheless important to quantify emissions to include them in the companies’ climate and sustainability reporting and – not least – to uncover emissions so that it is possible to reduce them through effective measures.
How we measure
We use advanced measuring equipment and digital tools to map and quantify potential emissions of methane and CO₂ from the reservoir surface and from the water that has passed through the turbines.
A floating chamber is placed on the water surface. It captures gas that would otherwise be released into the air, which may contain CO₂ and methane.
The gas is then analysed in a measuring device to determine the increase in greenhouse gas concentration within the chamber.
It is also possible to detect whether gas is being absorbed into the water instead of being emitted.
Bubble traps
Bubble traps are used to measure methane emissions from bubbling in the reservoir. These bubbles, which often appear in shallow areas through ebullition, can in some cases contain high concentrations of methane dependent on the sediment conditions.
We also measure parameters like temperature and oxygen levels as these factors influence the carbon cycle.
Additionally, it is crucial to measure emissions downstream of the turbines. Water passing through the turbines is often drawn from the bottom of the reservoir. In some parts of the world the highest greenhouse gas emissions occur in relation to the release of water downstream of the reservoir.
To estimate emissions before an area was flooded, we use maps, satellite images, and aerial photos and analyse similar vegetation from comparable locations. We also use models to estimate emissions in areas that has been dammed or in areas where reservoir establishment are planned.
Through these measurements and analyses, we can obtain a detailed picture of the climate footprint of a hydropower reservoir, in operation or planned.


Comments
No comments yet. Be the first to comment!