
Metocean data such as wave height, wind or current velocities is a necessary input to various types of research activities and industrial projects related to the marine environment: planning the extension of a harbour, choosing the most appropriate nearshore location for a new aquaculture site, designing the structure of a floating solar power system, dimensioning the mooring system of a floating wind turbine. Academics, researchers, industrials, policy makers working with near-shore or offshore topics need quick and simple access to metocean data. SINTEF Ocean develops a portal that answers this need.
Easy access to metocean data
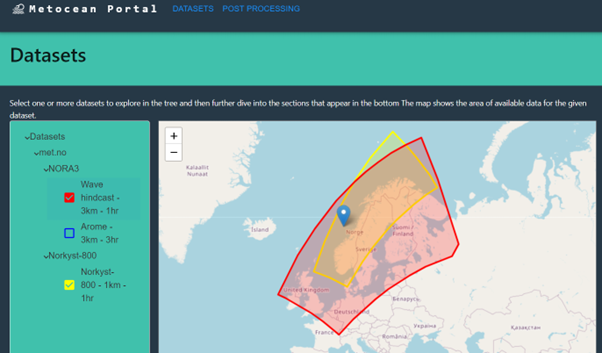
The main idea of the Metocean Portal is to simplify the access to metocean databases for end-users of different background. Through the graphical user interface (GUI), the user can explore the different databases, and quickly identify the available variables and metadata available in those data. The geographical area where the data is available is illustrated on an interactive map. The databases that have been made available so far through the portal are maintained and quality assured by the Norwegian Meteorological Institute (MET).
Data processing possibilities
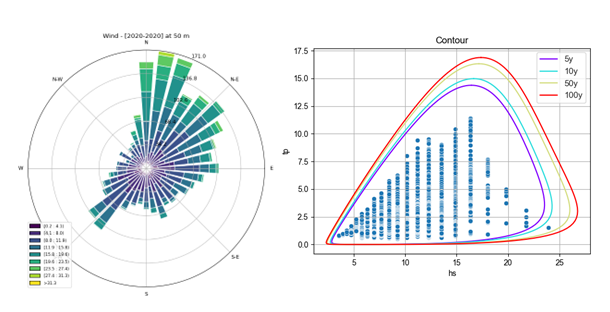
The Metocean Portal can also be used to postprocess the metocean data. Wind velocity and direction can be presented as wind roses (see left diagram below), wave height (hs) and periods (tp) can be represented in the form of a scatter diagram. More advanced statistical analyses are also available as the calculation of return periods and contour plots, for example (see right hand diagram below). The data processing functionalities are developed, and quality checked by MET and NTNU.
Code generation: A practical approach
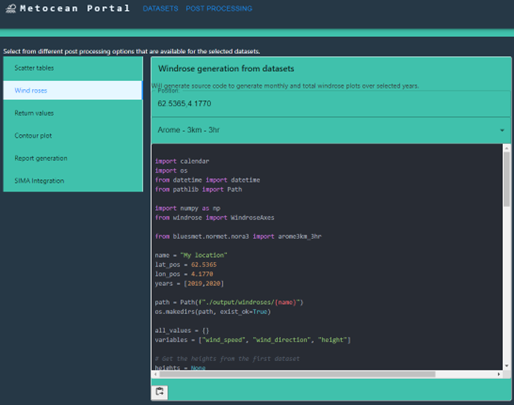
Functionalities as downloading and processing metocean data are implemented in a “Metocean code library” and made available through python commands (APIs). The Metocean Portal has been designed as a powerful companion to get acquainted with these APIs: it produces python code that contains calls to the APIs that correspond to the choices that the user has selected on the portal. The user can run this auto-generated python code locally on his/her PC to download and postprocess the data. It is a very versatile approach that corresponds to the need of most users, as he/she can modify, script, automate, improve and customise the generated code. The developed library is intended to be released as an open-source code by the end of the project.
Funding project: SFI BLUES
The SFI BLUES project aims to enable Norwegian industry to create new types of floating stationary structures, which will satisfy the needs and requirements from renewable energy, aquaculture, and coastal infrastructure. Research activities touches upon various scientific domains: optimisation, marine environment, wave-structure interaction, material technology, geotechnic, mooring and anchors. The Metocean portal is developed within work package 2 (WP2) and is currently being tested by the partners of the project.
Contacts: Neil Luxcey and Lasse Bjermeland.


Comments
No comments yet. Be the first to comment!