

However, wave energy technology is still at an early stage, and the maturity is not comparable to wind&solar energy (solar energy refers to photovoltaic technology in this blog post). New technology is expensive, and so are wave energy converters (at the moment). This is, however, neither surprising nor important; the important question is if wave energy can compete with wind&solar in the future.
After the blog was published, research has proceeded, and the analysis was repeated with a more solid data base. The new, more solid results, differ somewhat from the original preliminary findings published in the blog post below.
Read the article Quantifying the Market Value of Wave Power compared to Wind&Solar – a case study
Fortunately, the main message remains the same: Wave power achieves a higher value on the market than wind and solar power. However, the competitive advantage seems to be smaller than the first study implied. While the preliminary study saw wave power scoring 9% higher than wind power and 7% higher than solar power, the updated numbers are only 6% higher than wind power and 2% higher than solar power.
The finding that wave power scores above the average electricity price (102%) must be corrected, as it was found that it scores below (96%). This means that even though wave power has a positive seasonal correlation with the electricity price (the explanation for the preliminary result of 102%), negative correlation effects on shorter time scales counteract this “bonus”. This is mainly caused by the correlation between wind and waves, where wave power is partly affected by the wind power induced price fluctuations.
Comparing the competitiveness of waver energy with wind&solar
This question consists of two parts; the cost and the value. The cost part comes down to how cheap wave energy (with all the benefits of iterative design optimisation and mass production) could become in the future. In the MegaRoller project (which will develop and demonstrate a Power Take-Off for wave energy converters), a goal is to reduce the cost of wave energy through technology improvements. But, the question in focus for this blogpost is:
“How much value can wave energy deliver?”
If wave energy can deliver high value, high cost (higher than wind&solar) might be less of a problem than first anticipated.
The common approach
The simple answer to the value of wave energy would be:
Total Value = Power Rating * Utilisation Factor * Lifetime * Electricity Price
This equation gives a simplified expression for the total revenue of a power plant. The power rating is the maximal power that a unit can produce (with ideal weather), the utilisation factor is the long-term average of the expected power production in percent (with real weather), the lifetime is the time in which the unit is assumed to produce, and the electricity price is the revenue achieved when selling electricity on the market.
You may also like:
This approach is nice and simple, but it poses a problem: The “electricity price” does not exist as such. It is tempting (and common practise) to use the average electricity price (unweighted time-average), but this approach is highly problematic. It only works when the power production fluctuations (depending on wave height, wind speed and solar radiation) are NOT correlated to the electricity price fluctuations on the marked. This is however not the case (anymore); i.e. correlation does exist.
Wind, solar and wave energy are weather-driven power sources, that cannot store their primary energy carrier (unlike e.g. hydro power with a large reservoir). These weather-driven power plants adjust the quantity of their product offered on the market according to the resource availability.
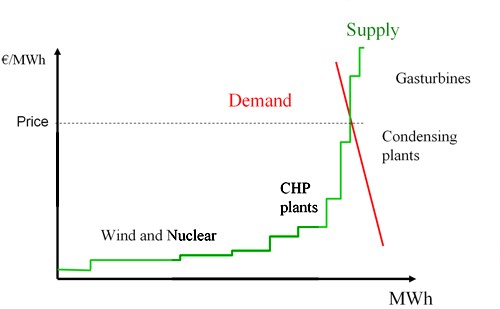
Strong wind and/or solar radiation lead directly to more supply on the market. These fluctuations of the marked supply result in market price fluctuations. Both wind&solar are big enough market players, that their supply bid significantly influences the market price; wave energy is not in that position (not now, neither in the near future).
This can be understood when looking at the figure below. The green curve represents the supply and the red curve the demand. Favourable weather resulting in higher output from wind&solar will shift the green curve towards the right. This will result in a lower point of intersection: a lower market price for electricity.
The correlation between weather-driven power production and market price (and the market price fluctuations in general) are steadily increasing with rising shares of wind&solar. This increasing correlation continuously undermines the premises which the simple economical assessment approach above is based on. In a sustainable future, this approach will not work at all.
Competitive advantage for wave energy
The mentioned correlation is negative (more power supply leads to lower prices) which is a disadvantage for the big weather-driven market players (wind&solar). This is, however, a competitive advantage for wave energy, or any other new technology, which does not rely on wind speed or solar radiation.
You may also like:
Of course, waves are caused by wind, so wave energy does in the end depend on wind, in the same way that wind depends on solar radiation (which is the main cause for wind). However, these relations function on a global scale. Locally, they are rather loose, creating a local weather pattern where they appear as almost independent. It is not always windy on sunny days and it might be windy at night too. Big ocean waves can hit the coast without wind being present right here right now. These waves might have been created (by wind) days ago and far away. All of this is considering waves on the large oceans; on small water surfaces like a lake, correlation between wind and waves is (of course) much stronger.
Example: When the wind is strong, a lot of wind energy is available on the electricity market pushing prices down. When the wind is not blowing, electricity is scarce leading to higher market prices. When a wind power plant is able to produce, its product is not valued high on the market, and at times when revenues theoretically would be high, it cannot produce. The wind power plant therefore sees an average revenue which can be significantly lower than the unweighted time-average of the electricity market price.
The simple approach, that does not account for correlation, is incapable of capturing this competitive advantage of wave energy. Using it might lead to false conclusions. The hypothesis here is:
If wave energy delivers more value per kWh than wind&solar, it may well be more expensive, but it still can be economically competitive.
Levelised Cost of Energy
The costs of renewable electricity production technologies are usually economically assessed with a simple measure: The Levelised Cost of Energy (LCoE). This measure intends to capture the energy-average electricity production cost (considering both investment and operation cost) over the entire life-time. In other words, it is the total life-time cost divided by the total life-time electric energy produced. Using this measure, different production technologies can be compared, identifying which technologies are cheaper and which are more expensive per kWh.
This approach is attractive, since it is simple, but there are also problems: It does not work well for fuel-based production technologies, since their life-time cost and life-time production cannot be known a priori. These are highly sensitive towards assumptions regarding future electricity and fuel prices. Depending on these prices, a fuel-based unit will only produce when the revenue can cover the fuel cost. Low electricity prices and high fuel prices lead to the unit not operating, which increases the LCoE, as the investment cost are split among fewer hours of operation. The approach is therefore problematic for comparing e.g. wind energy with combined cycle gas turbines. However, such comparisons are very common anyhow.
The improved approach: Levelised Value of Energy (LVoE)
To compare wave energy with wind&solar, it is important to get a better measure for the expected revenue, which correctly takes the correlation of production pattern and electricity price fluctuations into account. Here, it is needed to not calculate a time-average, but an energy-average:
“for what price can the average kWh be sold?”
The well-established measure of the LCoE is such an energy-average. A similar measure would be needed for the market value of sustainable energy. This could be called the Levelised Value of Energy (LVoE). While the LCoE refers to the average cost of producing one kWh, the LVoE refers to the average revenue of selling one kWh. However, determining this LVoE is not straight-forward.
The case study
To determine such a LVoE for wind, solar and wave energy, a case study has been conducted. This study is based on a western Mediterranean 2030 scenario (taken from the EuroSunMed EU FP7 project); 2030 as a target year for commercial utilisation of wave power plants, western Mediterranean because of the location of the MegaRoller prototype in Portugal. The tool PowerGAMA (developed in-house at SINTEF) has been used for the study.
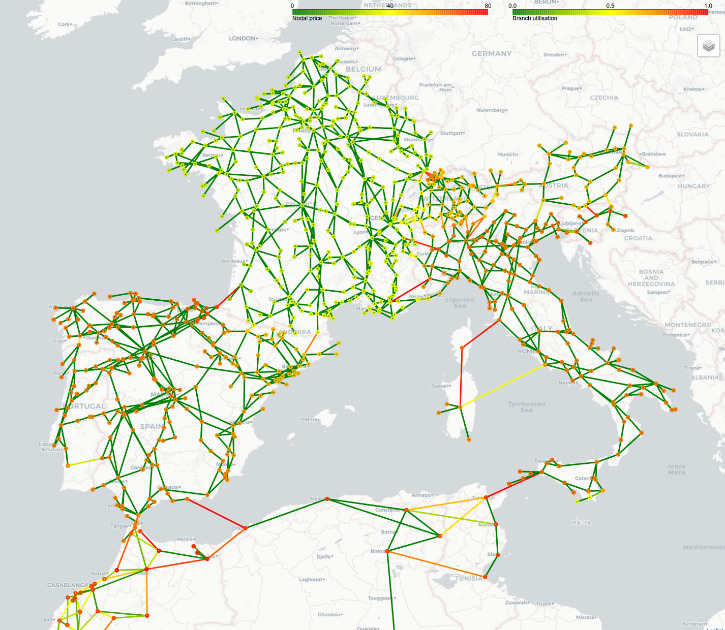
PowerGAMA (Power Grid And Market Analysis) is an open-source Python package. It is a lightweight simulation tool for high level analyses of renewable energy integration in large power systems. It uses a simplified representation of the power system and power market, and it also represents energy storage to capture time-variance.
It optimises the generation dispatch, based on marginal costs for each timestep over a given period, for example one year. It takes into account the variable power available for solar, hydro and wind power generators, and also the variability of demand. Moreover, the power flow in the AC grid is determined by physical power flow equations. Since some generators may have an energy storage (hydro power) the optimal solution in one timestep depends on the previous timestep, and the problem is therefore solved sequentially.
The simulations create a electricity price time series which is correctly correlated to the applied input weather time series. With these correlated times series, the LVoE has be calculated. This calculation is far from being perfect, as it is based on a simplified model, only a single weather year, suboptimal weather data, fuel price assumptions, uncertainty about the amount of wind&solar in the future etc… However, it is still by far better than just using the time-average market price (which of course is identical for wind, wave and solar energy).
Case study results – great potential for wave energy
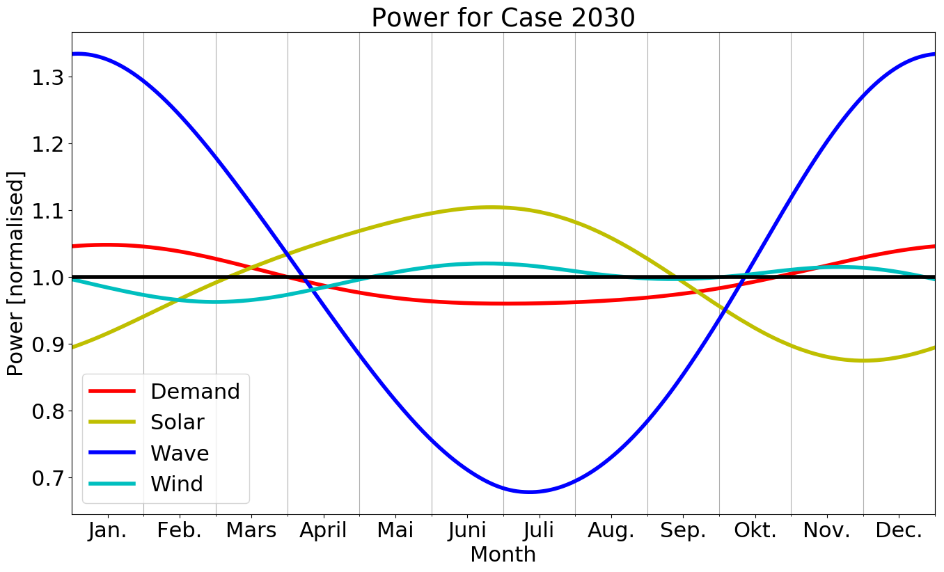
The results from the case study clearly support the hypothesis (wave energy delivering more value than wind&solar…). This is due to the aforementioned (now quantified) negative correlation for wind&solar, but also due to a POSITIVE correlation for wave energy. Wave energy does not follow a clear day-night pattern (unlike solar energy), but it has a clear summer-winter pattern: the waves are larger in the winter. This is positively correlated with the fact that electricity prices often are higher during the winter (less solar energy, more load).
These correlations lead to wave energy experiencing a slightly higher revenue (102%), while wind&solar experiencing significantly lower revenue (93% / 95%). Reference (100%) is the unweighted time-average electricity price, as used in the simple approach described above.
In the studied case, wave energy is valued around 8% higher than wind&solar
This number is, however, case-dependent. It might be significantly higher if looking:
- at a smaller power system than continental Europe (e.g Ireland)
- further into the future (with higher shares of weather-driven sources)
In a smaller power system, the challenges from weather-fluctuations are generally more pronounced. This also means, that the value reduction that wind&solar experience should be stronger, resulting in a more pronounced competitive advantage for wave energy. When increasing the time horizon (e.g. 2040), basically all prognoses foresee that the shares of wind&solar will significantly grow over time. This will gradually strengthen the position of wave energy.
You may also like:
Overall, this means: Wave energy does not need to reach cost-parity with wind&solar to be competitive. As it delivers higher value to the electricity market, it can also recover higher cost. However, the effect is not strong enough to make wave energy at today’s LCoE competitive. But it shows that competitiveness, achievable through cost reductions, is not as far away as it might seem, especially in the long run and for smaller power systems.
If wave energy really succeeds, resulting in large scale deployment, the market power will eventually grow strong enough to influence the market prices, decreasing the competitive advantage. However, this is not problematic as it only might happen if wave energy already is competitive.
This study can by no means prove that wave energy will be profitable, but it gives a nice reminder that a too strict focus on the LCoE is not meaningful. In a sustainable future, we will also need to look more at the LVoE. There are and always will be days that are not so windy and sunny.
Wind and solar energy are great, but the power system will stand better on three legs


Comments
It is four legs: water, wind, wave and sun energy.
LCOE about € 0,05/kWh can be the case if we use hybrid technology like “AquacultureWindWaveEnergy”, AWWE, 4Wind1Wave or “AquacultureWindWaveHybrid, AWWHybrid.
When the electricity price is low we can store wind and wave energy in hydro dams, by pumping.