

Such blackouts may have a very low probability of occurring. But if they do occur, the consequences (impact) can be very high. Therefore, they are often referred to as High-Impact Low-Probability (HILP) events, or extraordinary events. And because the impact is so high, we need methods and tools to mitigate the risk of HILP events in power systems.
How can Transmission System Operators use HILP tools?
In the HILP project we have developed methods and tools for analysing risk and vulnerability related to HILP events. They have been developed in cooperation with Transmission System Operators (TSO) and energy regulators, focusing on the Nordic power system. Among other things, new methods and tools help raise awareness of potential vulnerabilities, identify promising barriers against HILP events, and strengthen the ability of TSOs to make the trade-off between security of supply and societal costs in planning and operation of the Nordic power system.
To understand these tools and methods, we first need a little more background on High-Impact Low-Probability events.
You may also like:
Why are high-impact low-probability events challenging?
The impact of blackouts includes direct and indirect economic consequences to the end-users of the power system, or in other words power supply interruption costs. The dependence of other critical infrastructures on the power system may in addition lead to indirect societal costs that are just as large or larger.
For the TSOs and for society at large, HILP events are particularly challenging to analyse, understand and identify. Compared to “ordinary” power supply interruptions, the cause and effect relationships are more complex, the uncertainties are greater, and it is psychologically more challenging to deal with events believed to be extremely unlikely or even unimaginable.
The challenge is amplified by the increasing complexity and uncertainties of the power system due to integration of distributed renewable power generation, more extreme weather, and stronger integration between the Nordic power system and the power systems in the rest of Europe, among other things.
Understanding high-impact low-probability events
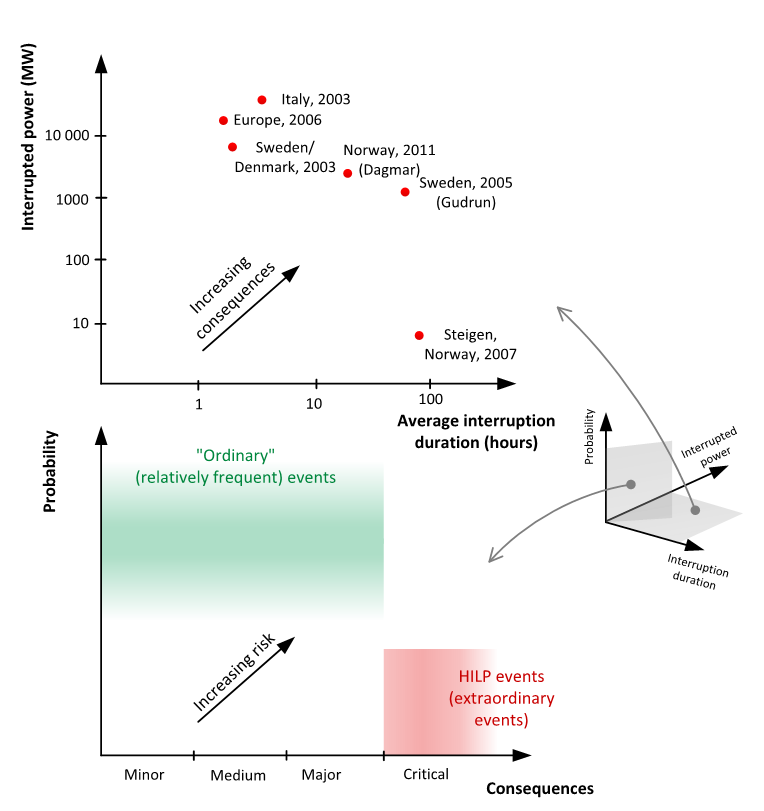
To illustrate the concept of HILP events in power systems, examples of historic events are depicted in a two-dimensional consequence diagram in the upper part of Figure 1. Here, the consequences are measured in terms of total power interrupted (MW) at end-users and interruption duration (hours). (Note however, that consequences in general can be measured along other dimensions such as societal costs, consequences for health and life, etc.)
Both events with a) extraordinarily high magnitude of the power interrupted such as the blackouts of Italy and Sweden/Denmark in 2003, or b) extraordinarily long interruption durations such as the storm Gudrun in South-Sweden in 2005, can be regarded as extraordinary (HILP) events.
Extraordinary events in power systems typically fall into two main categories:
- Those primarily due to natural hazards (e.g. major storms), characterized by extensive physical damage to the infrastructure and consequently long restoration times and interruption durations.
- Those attributed to more diverse and complex causes and sequences of events, including technical and operational failures, human errors, or intentional attacks.
The lower part of Figure 1 shows a risk diagram with a single, combined consequence dimension along the x axis. HILP events with critical consequences, but low estimated probabilities can be found in the lower-right corner.
Framework for analysis of HILP events
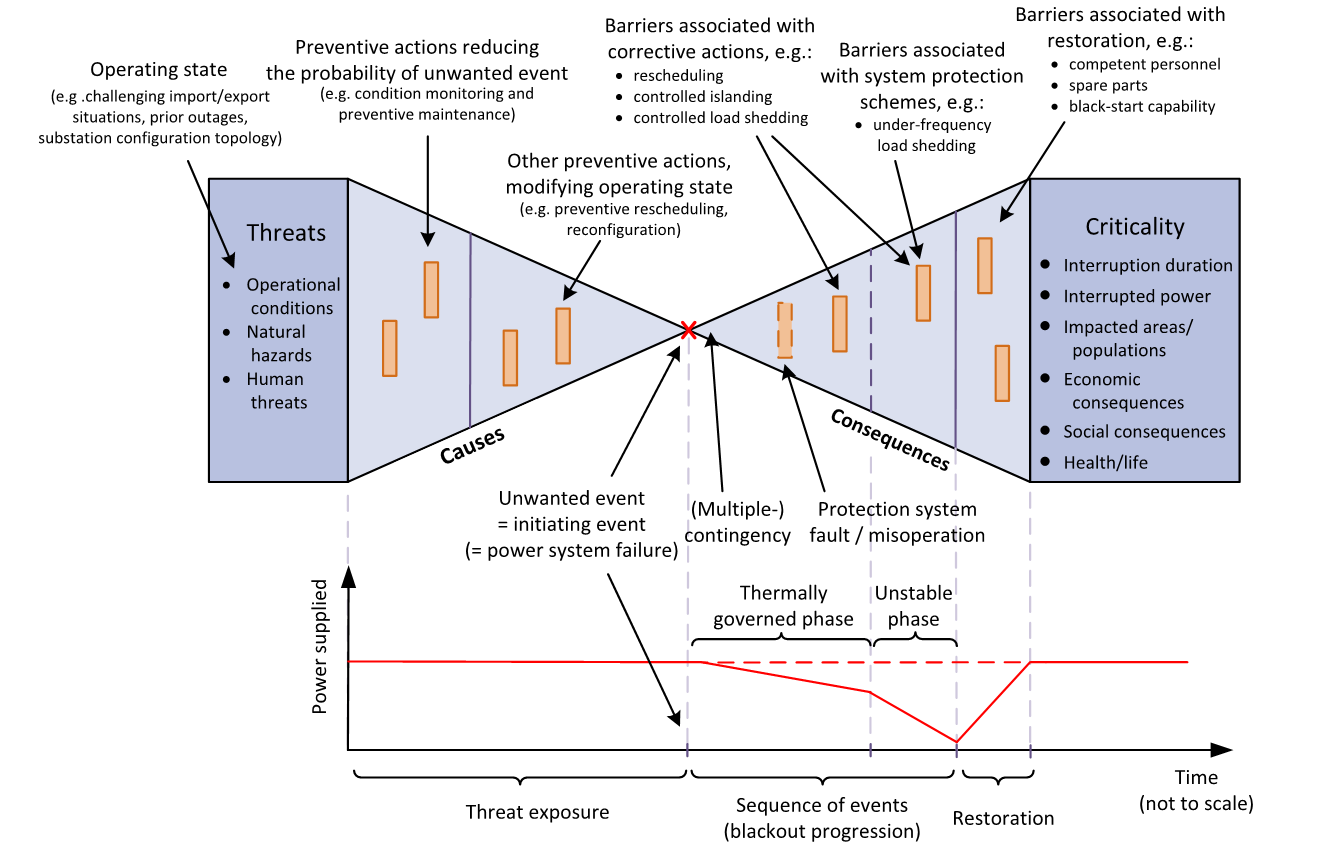
In the initial phase of the project, a qualitative framework for analysing HILP events was developed by extending an existing framework for vulnerability analysis. The extended vulnerability analysis framework and its application to a variety of real power system cases is summarized in an openly accessible journal article. HILP events can involve a multitude of aspects. This is illustrated in Figure 2, where relevant aspects are mapped to a bow-tie model describing the relations between causes and consequences of HILP events.
One realization we made early in the HILP project was that there is no single holistic method to quantitatively analyse HILP events that can capture all aspects. An appropriate combination of qualitative and quantitative techniques must therefore be employed to capture the characteristic aspects for each case. Another key insight is that it is valuable to complement detailed, quantitative analysis with more qualitative initial assessments.
Vulnerabilities related to outage of HVDC interconnectors
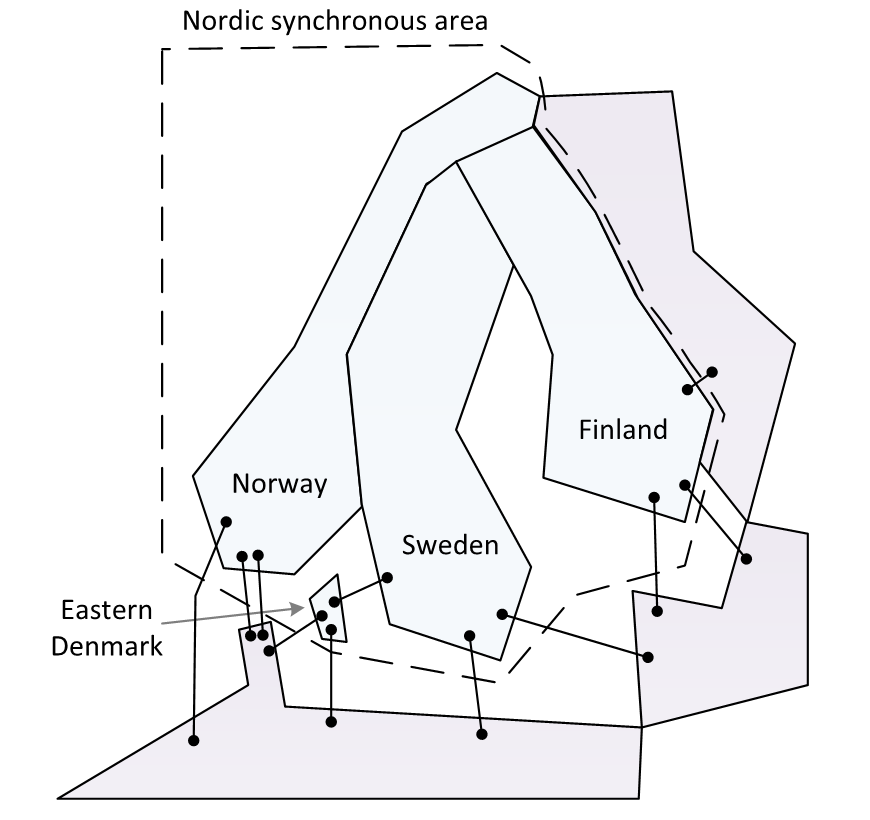
The vulnerability analysis methodology was applied in a case study together with the Finnish TSO Fingrid on vulnerabilities related to outage of HVDC (High-Voltage Direct Current) interconnectors in the Nordic power system, schematically illustrated in Figure 3. This case study is described in detail in the blog post Nordic power system: Vulnerability analysis of HVDC contingencies.
In the case study, insufficient system inertia was identified as an important vulnerability influencing factor. The Nordic power system may not be particularly vulnerable to HVDC outages today, but there are reasons to pay attention to how the vulnerability will develop in the future. Especially with regards to decreasing system inertia.
A dynamic analysis was subsequently carried out to illustrate these principles quantitatively. It focused on fast load-based reserves (demand-side response) as a barrier identified as promising to avoid critical consequences. More generally, the study increased the awareness of potential vulnerabilities and provided input to risk management and emergency preparedness measures at Nordic TSOs and regulators.
Weather-related blackouts
Blackouts due to extreme weather is a notable category of HILP events. Weather-related threats have high intensity during short periods of time and can cause simultaneous outage of multiple power system components (“failure bunching”). In addition, bad weather can delay the repair of components and increase the outage time.
We have developed methods for estimating time-dependent probabilities for wind-related failures of overhead transmission lines, and models for how the outage time of transmission lines depend on weather conditions. Parts of this work has been led by Statnett and implemented in their MONSTER tool for probabilistic long-term reliability analysis.
Dealing with uncertainties related to HILP events
HILP events are intrinsically associated with large uncertainties that are challenging to deal with and interpret for analysts and decision makers. In planning and operation of the Nordic power system, the TSOs need to make the best possible trade-off between security of supply and societal costs in the decisions they make. Focusing on system development decisions, we developed a methodology accounting for uncertainties due to HILP events in socio-economic cost-benefit analysis.
In a case study in collaboration with Statnett, the methodology is applied to a real grid investment decision, as schematically illustrated in Figure 4. Here, somewhat simplified, an additional transmission line (shown in red) is considered as a measure to reduce the risk of blackout of Area 2.
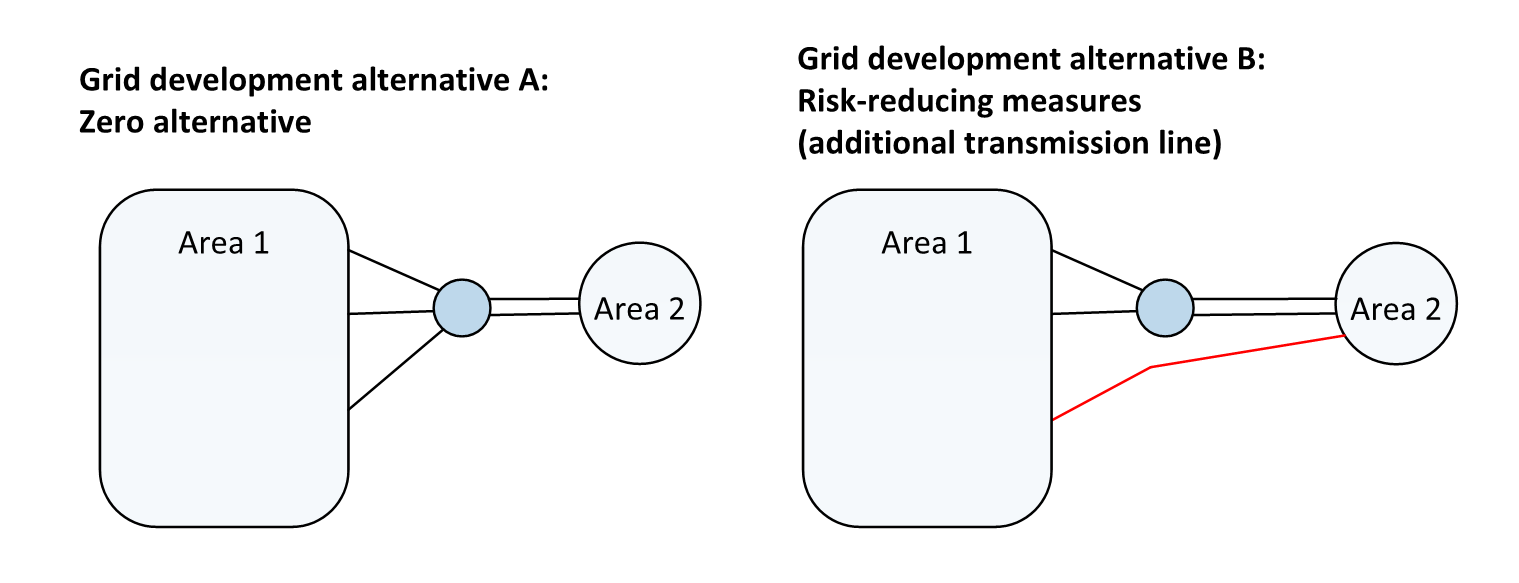
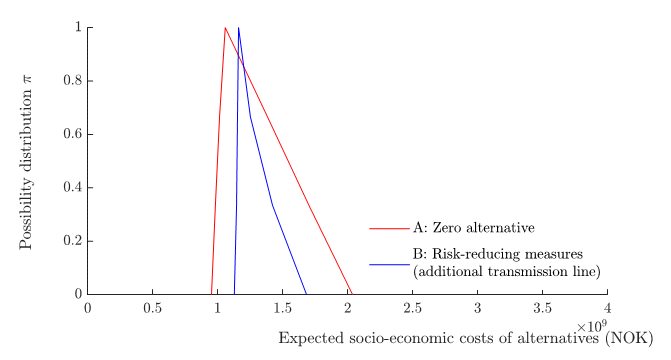
Compared with the reference (zero) alternative, investing in an additional transmission line is not cost-effective if you only consider expected values and neglect uncertainties. Our methodology provides a more comprehensive description of risk that considers both random variation and lack of knowledge and describes both the probability and the degree of possibility of different outcomes. The case study showed how conclusions based on best-guess estimates and expected values may not hold when uncertainties are considered more comprehensively.
The distribution functions in Figure 5 show the degree of possibility for the expected socio-economic costs of the grid development alternatives. The total costs (which include power supply interruption costs) are most likely higher with an additional transmission line. However, the figure also illustrates how investing in risk-reducing measures greatly decreases the uncertainty in the socio-economic costs of the alternatives. And because of our lack of knowledge related to HILP events, it is possible that the risk-reducing measures are cost-effective after all.
Analysing complex sequences of events leading to critical consequences
One main category of HILP events is characterized by often having a single initiating failure event, followed by complex sequences of causally related events and barrier failures, eventually leading to critical consequences. Therefore, we have developed a general modelling framework and a quantitative vulnerability analysis methodology (the GraphCAT tool) for analysing such sequences of events.
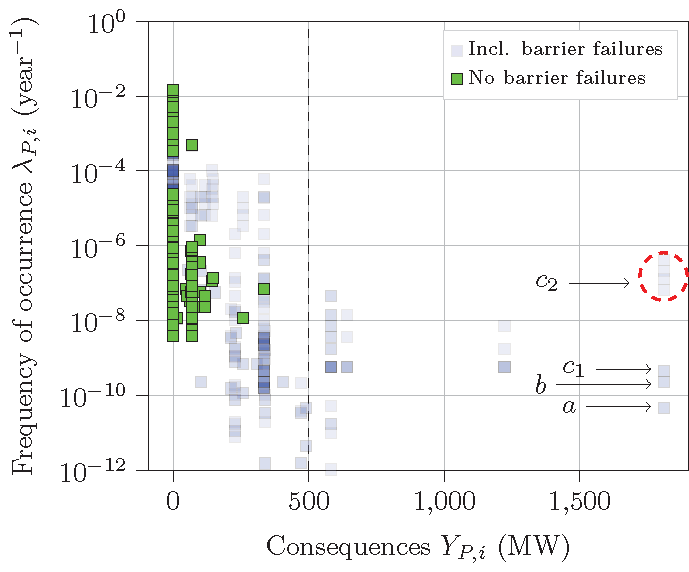
Figure 6 shows a risk diagram where each data point corresponds to a sequence of events for a power system case. The green data points correspond to the sequences of events identified when neglecting the possibility of barrier failures. The events represented by blue data points are obtained by considering barrier failure, which here include failure of corrective actions (generation rescheduling and controlled load shedding), the failure of islanding, and protection system failures.
On the far right-hand side of the figure are a set of labelled events; these identified HILP events all involve the failure of islanding. Among these, the events labelled c2 are estimated to be more likely than the others; this is because these events can occur through the failure of protection systems. These results illustrate how considering barrier failures is crucial to be able to identify and analyse HILP events.
About the HILP project
“Analysis of extraordinary events in power systems” (“the HILP project” in short) was the title of a four-year knowledge-building project led by SINTEF Energy Research including project partners Statnett (the Norwegian TSO), Fingrid (the Finnish TSO), NVE (the Norwegian energy regulator), and NTNU. The project was concluded in June 2020.
The project was supported by the Research Council of Norway under the ENERGIX programme (Grant 255226). Projects co-workers at SINTEF and NTNU and other project partners are thanked for their contributions and collaboration.


Comments
Did this project lead anywhere in developing a real-time prediction risk analysis? If yes what mathematical method were used, Monte-Carlo or Markov?
Very interesting, thanks for sharing and please keep posting these interesting blog posts 🙂