


The IPCC Fifth Assessment Report points out that CO2 capture and storage (CCS) is one of the essential technologies to mitigate climate change. CCS systems need to be designed and operated in a safe and efficient way, and accurate models and data are a prerequisite to do that.
We have been working on the development of models to describe the flow inside, and out of, pipes and wells, see e.g. our blog ‘CO2 transport requires quantification’. These models describe the flow in one dimension. For some applications, such as simulations of the near field of a CO2 jet resulting from the decompression of equipment containing high-pressure CO2, this is not detailed enough and one needs to consider the full three-dimensional nature of the flow.
High-order parallel computations
In the project ‘3D Multifluid Flow’, funded by the Research Council of Norway through the basic grant to SINTEF Energy Research, we have combined our models describing the thermodynamic behaviour of gas, liquid and solid CO2 (and combinations) with highly accurate numerical methods for 3D flow. Such methods can describe the flows with a given accuracy with less CPU cost than more conventional methods. Nevertheless, the multiphase flow of CO2 is highly complex and the computations must be run in parallel on large computers. Some of the computations were run on the Notur high-performance computing infrastructure.
Validation for a barrel shock
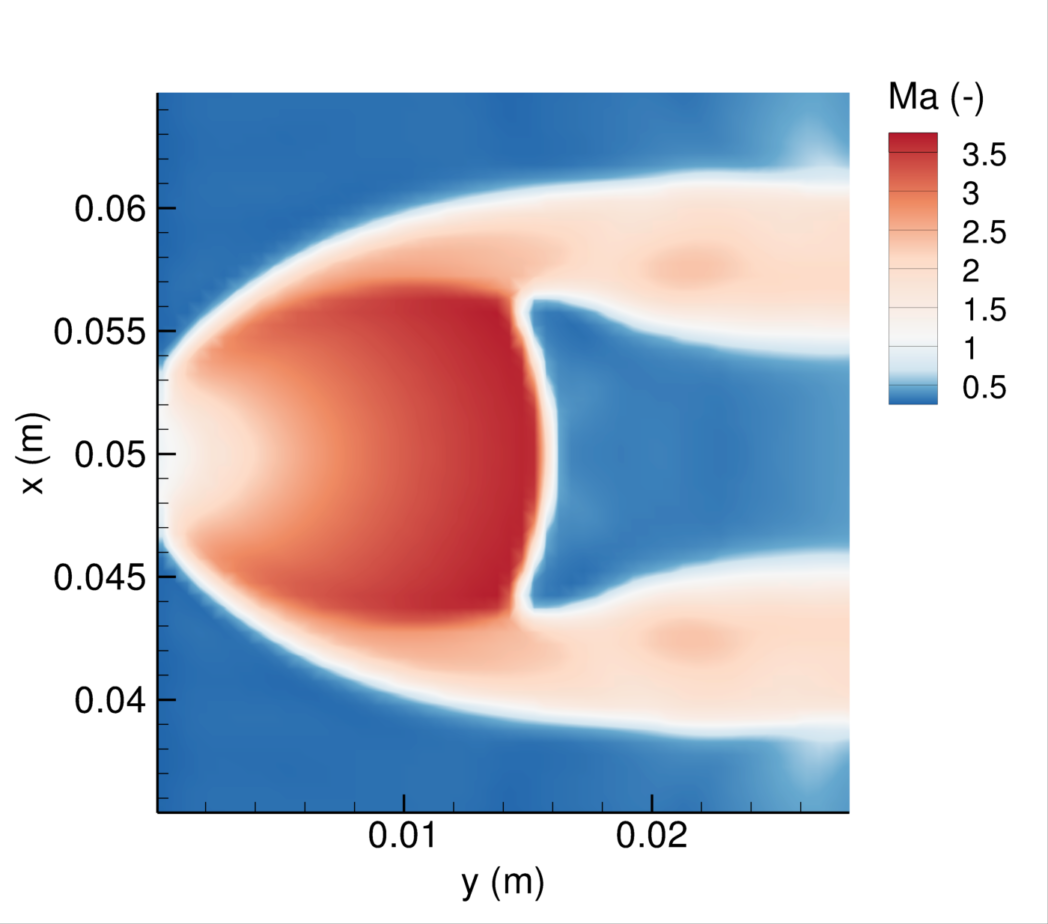
This work was recently published as an article in the Journal of Computational Physics. (The article may also be read in the form of a preprint). In the article, we verify and validate our new simulation code on test cases and data from the literature. In particular, we consider the direct numerical simulation (DNS) of an air jet. In this context, DNS means that the turbulence is described with a method resolving the flow both temporally and spatially, without resorting to turbulence models. Finally, we consider the flow of pressurized CO2 exiting through a small nozzle, forming a highly underexpanded jet and containing gas, liquid and solid CO2. In this situation, a barrel shock is formed, and the shape and size of our calculated barrel shocks agree very well with previous laboratory observations. The barrel-like shock structure can be seen in the illustration below.
The above video illustrates the development of turbulence in a CO2 jet. CO2 with an initial pressure of 52 bar is flowing out through a nozzle of diameter 1 mm. The colours show the vorticity magnitude, a measure of the fluid rotation.
Given these good results, we would like to continue the work on the method and apply it for the calculation of complex CO2 flows occurring in jets, process equipment and pipelines or wells.


Comments
No comments yet. Be the first to comment!