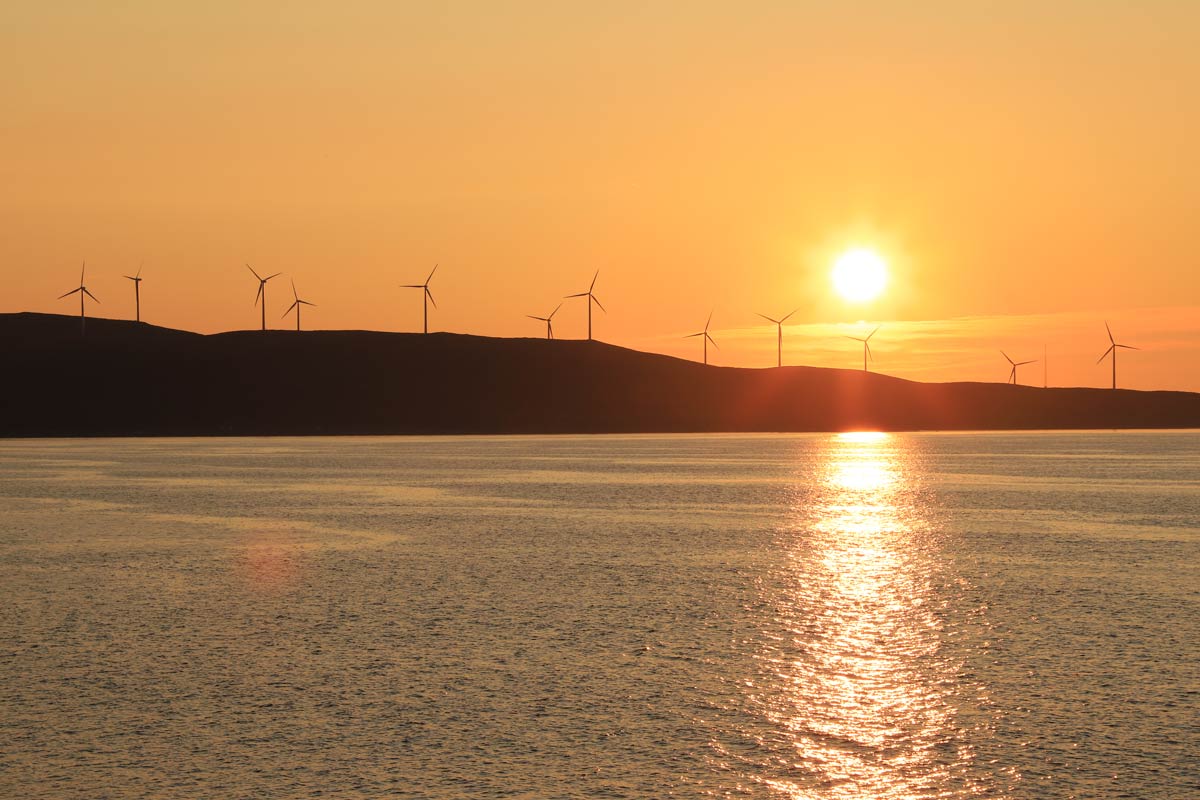

The energy transition and biodiversity conservation are often discussed as parallel challenges. While energy system models are increasingly used to explore pathways towards climate neutrality, biodiversity is rarely represented explicitly within these modelling frameworks. At the same time, land-use change remains one of the most important direct drivers of biodiversity loss, making it increasingly relevant to understand how renewable energy expansion and biodiversity protection interact.
I carried out this work within Research Area 2 (Impact on Biodiversity) of the InterPlay Research Centre, investigating how biodiversity information can be integrated into a large-scale energy system model and what implications such integration may have for future energy system development.
Rather than asking where renewable energy should or should not be built, the study focused on a more fundamental methodological question: How does the representation of biodiversity influence the land available for renewable energy deployment, and how do these changes propagate through an interconnected energy system?
From species-richness maps to energy system constraints
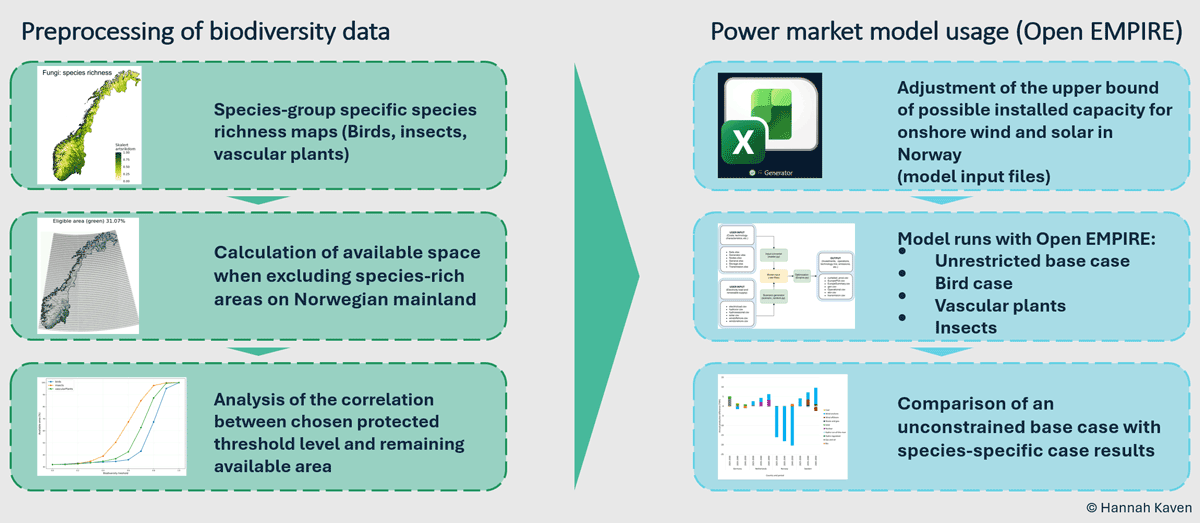
The study builds on species-richness maps developed through the Hotspots Pipeline at NTNU. These maps are based on integrated Species Distribution Models (iSDMs) and represent the estimated relative species richness of terrestrial birds, insects, and plants across Norway.
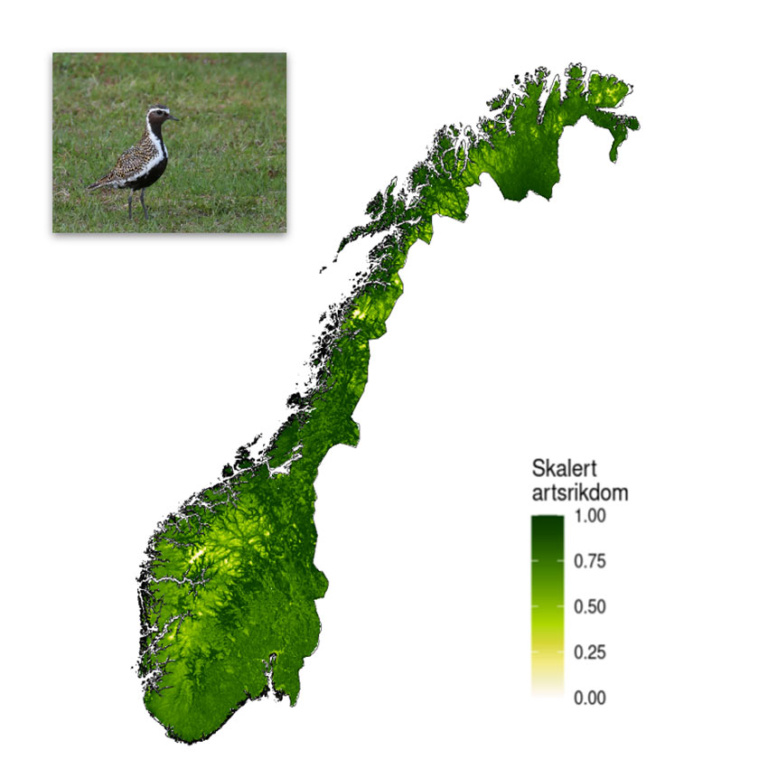
Importantly, the three species groups were analysed separately throughout the study. For each species group, species richness is represented as a continuous value scaled between 0 and 1. A value of 1 corresponds to pixels with the highest estimated species richness within that species group, while a value of 0 represents the lowest observed richness.
Scaled species richness
Species richness is the number of different species found in a given area. Scaled means that the absolute numbers have been divided by the highest number found, giving a scale from 0 to 1.
The map shows scaled species richness (in Norwegian: skalert artsrikdom) for 500 × 500 m pixels across Norway, i.e. how many different bird species have been recorded in each square relative to the richest one.
© Hannah Kaven
In this study, species richness values were scaled between 0 and 1 separately for birds, insects, and vascular plants. This scaling allows thresholds to be applied consistently within each species group. A value of 0.8 for birds does not necessarily correspond to the same absolute number of species as a value of 0.8 for insects or vascular plants. Instead, the values describe the relative distribution of species richness within each group.
To investigate how biodiversity influences land availability, species-richness thresholds were applied incrementally from 0 to 1. Areas exceeding a given threshold were excluded from future renewable energy deployment, allowing the remaining available land area to be quantified.
The resulting exclusion layers were then translated into reduced upper bounds for renewable energy deployment in Norway and implemented within the European power system model Open EMPIRE .
A non-linear relationship between biodiversity thresholds and land availability
One of the most interesting findings emerged before the energy system modelling even began.
When increasing species-richness thresholds were applied to the exclusion layers, the reduction in available land did not follow a linear pattern. Instead, all three species groups exhibited an S-shaped relationship between threshold values and remaining available area.
On the horizontal axis, a low threshold is strict: it protects any area above even a modest level of species richness, so less land is left for energy infrastructure deployment. A high threshold is permissive: it protects only the very richest areas, so more land remains available. The S-shape then shows the trade-off is uneven: near either end, shifting the threshold changes the available land only slightly, but through the middle a small shift moves a large share of land in or out.
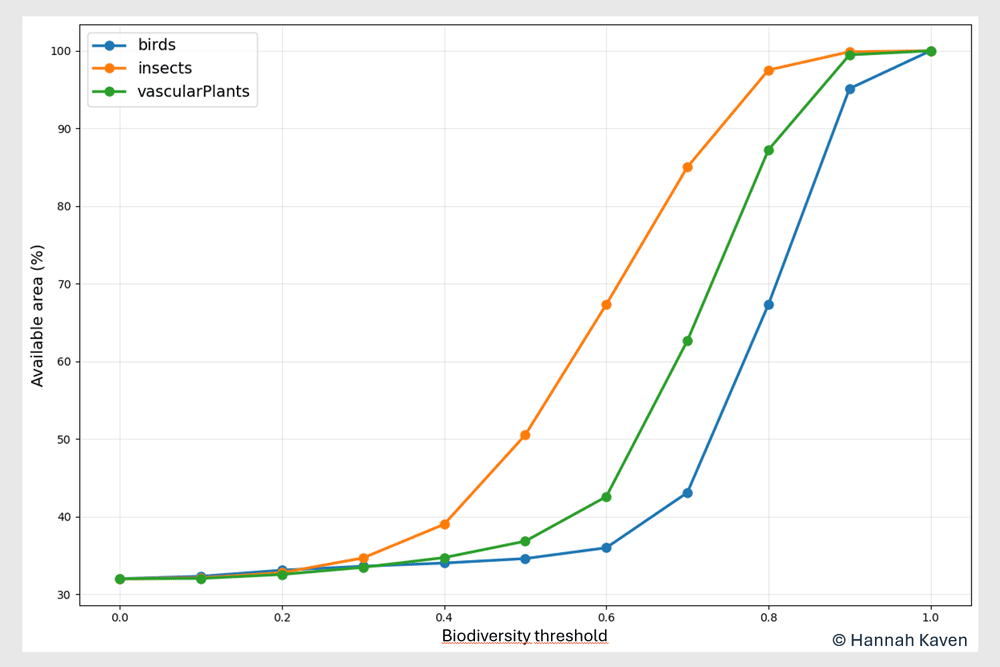
At lower threshold values, increasing protection resulted in relatively modest reductions in available land. Around a threshold value of 0.5, however, the relationship entered a steeper phase where small changes in the threshold led to substantially larger reductions in available area. At very high threshold values, the curve flattened again.
This non-linearity is important because it demonstrates that biodiversity constraints cannot be assumed to scale proportionally with land availability.
The analysis also revealed notable differences between species groups. At a threshold of 0.5, approximately half of the available land remained in the insect case, whereas only around one third remained in the bird and vascular plant cases.
These differences arise because the underlying species-richness distributions differ between taxonomic groups. As a result, applying the same numerical threshold does not necessarily exclude the same share of land.
For the energy-system modelling that follows, a single threshold of 0.5 was applied to all three species groups.
Selection of a relative species richness threshold of 0.5
The threshold value of 0.5 was chosen for the energy system analysis because it lies close to the inflection region of the S-shaped relationship between species-richness protection and land availability.
In this region, relatively small changes in biodiversity protection lead to disproportionately large changes in available land, making it particularly relevant for studying system-level effects.
© Hannah Kaven
What happens when biodiversity enters an energy system model?
The next step was to investigate how biodiversity-based land constraints influence future energy system development.
The biodiversity thresholds were incorporated into Open EMPIRE by reducing the maximum deployable capacity of onshore wind and solar power in Norway according to the remaining available land in each scenario.
The resulting model runs indicate that biodiversity constraints influence technology deployment differently.
The largest impacts were observed for onshore wind power. Compared with the reference case, annual Norwegian onshore wind generation decreased by approximately 13–21 TWh until 2050 depending on the species group considered.
Solar power was affected to a much smaller extent, with reductions remaining below 1 TWh per year.
The results were broadly similar for birds and vascular plants, reflecting the comparable amount of land excluded at the selected threshold. Because the insect scenario restricted a smaller share of land, it also resulted in higher wind-power deployment than the other biodiversity cases.
These findings highlight that biodiversity representation matters. Different biodiversity datasets can lead to different estimates of available land and, consequently, different energy system outcomes.
Biodiversity constraints propagate beyond Norway
Because Open EMPIRE represents a large interconnected European power system, the effects of biodiversity constraints were not limited to Norway. The constraints themselves were applied only to Norway; the rest of Europe was modelled without them.
Reduced renewable generation in Norway was partly compensated through increased generation elsewhere in Europe. The model results show that Sweden increased wind generation, while Germany and the Netherlands compensated through different combinations of wind, solar, gas, and nuclear power depending on the time period considered.
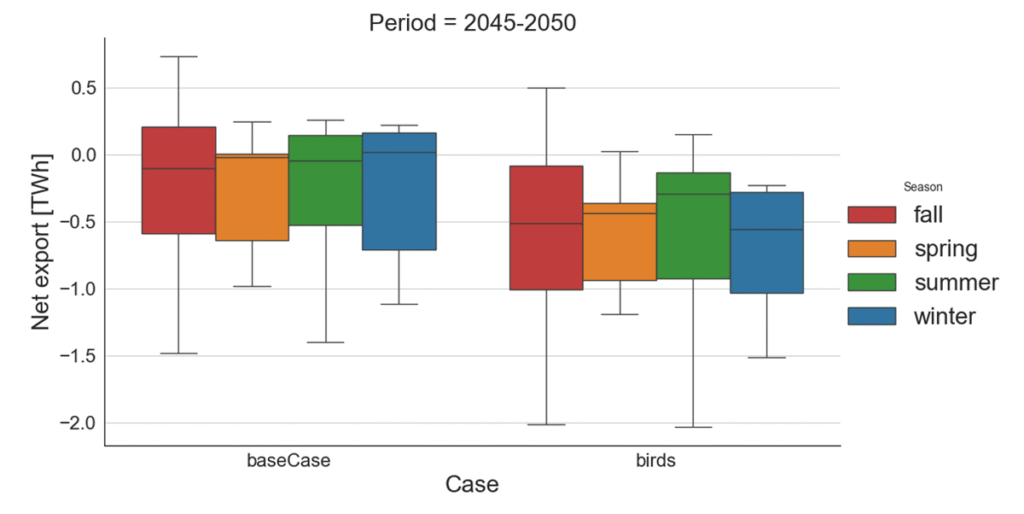
Norway nonetheless remained a net exporter of electricity throughout the model horizon, although export volumes generally declined compared with the reference case.
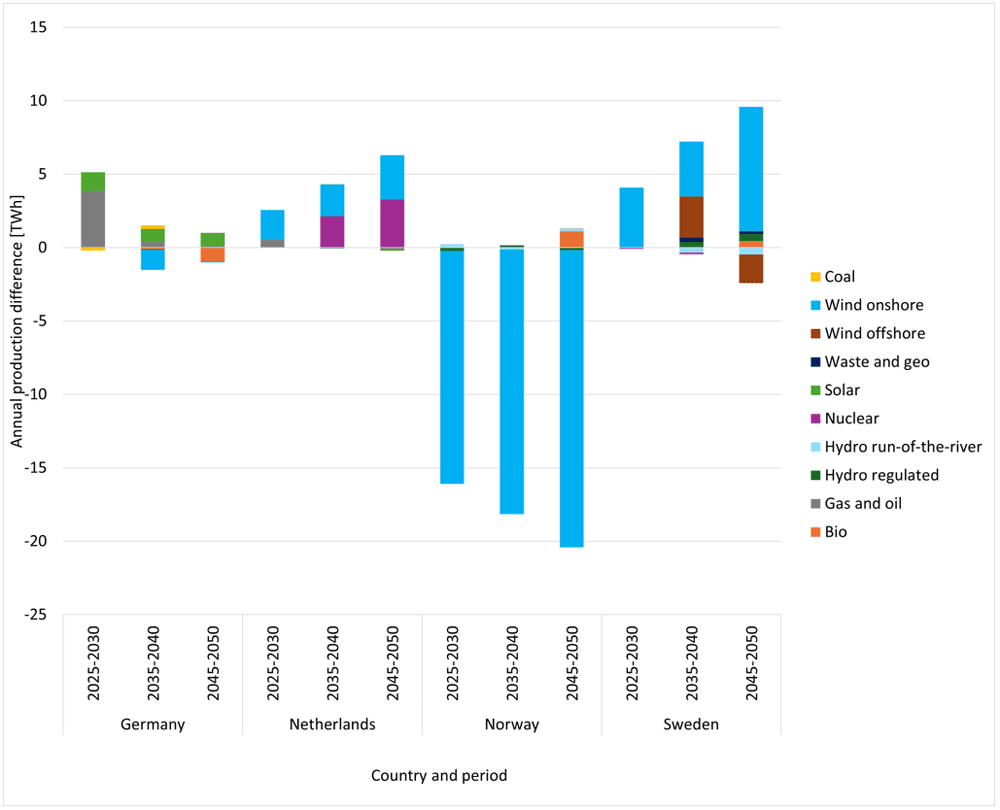
The figure illustrates an important aspect of energy system modelling: land-use decisions in one country can influence investment decisions and generation patterns across the wider European system. It also points to a limitation of the study. If the same constraints were applied across Europe, generation would still have to shift somewhere, but the model cannot say where, or whether the land it moved to would be any less valuable for biodiversity.
What does this mean for future research?
The primary contribution of this work is not a recommendation for a specific biodiversity threshold or conservation strategy. Rather, it demonstrates a practical approach for incorporating biodiversity information into long-term energy system modelling.
The threshold analysis showed that the relationship between species richness and land availability is non-linear and differs between taxonomic groups. These characteristics are not captured when biodiversity is represented through simplified or uniform land-use assumptions.
For the InterPlay Research Centre, this highlights both the opportunities and challenges of interdisciplinary research. Biodiversity data contain patterns that are highly relevant for energy system planning, but translating ecological information into model constraints requires careful methodological choices.
As biodiversity considerations become increasingly important in energy planning and policy, understanding how these choices influence model outcomes will become equally important.
This study represents one step towards bridging that gap by connecting biodiversity data and energy system modelling within a common analytical framework.
Hannah Kaven completed her master’s thesis as part of FME InterPlay, working closely with SINTEF research scientists, from November 2025 to May 2026. She also presented her paper with this topic at the European Energy Markets conference in Trondheim in June. Her publication can be found here: Power System Impact of Limiting Wind and Solar Deployment in Species-Rich Areas: Norwegian Case Study






Comments
No comments yet. Be the first to comment!