Skip to content

SINTEF Blog Gå til forsiden

  • Energy
  • Ocean
  • Digital
  • Health
  • Industry
  • Climate and environment
  • Building
  • Society
  • EN
  • NO
Energy Industry

Graphene – better efficiency in steam turbines

author
Marit Jagtøyen Mazzetti
Senior Researcher
Published: 22. Nov 2015 | Last edited: 16. Apr 2025
2 min. reading
Comments (0)

A large part of the world’s power production occurs from power plants utilizing steam turbines for power production. The turbines work on either coal, gas or biomass and often in a combined cycle gas turbine which contains a steam cycle and a condenser to cool the steam to water for recycling.

Coal and gas fired power plants emit large amounts of CO2 and it is therefore important that these plants operate as efficiently as possible.

Norway is an exception

97 % of Norwegian onshore energy supply is provided from hydropower and therefore emission free. However the oil and gas industry utilizes gas fired turbines offshore.

heat exchangers coated with grafen
Method for coating heat exchangers in steam cycles with graphene

Graphene – Improved method for coating heat exchangers

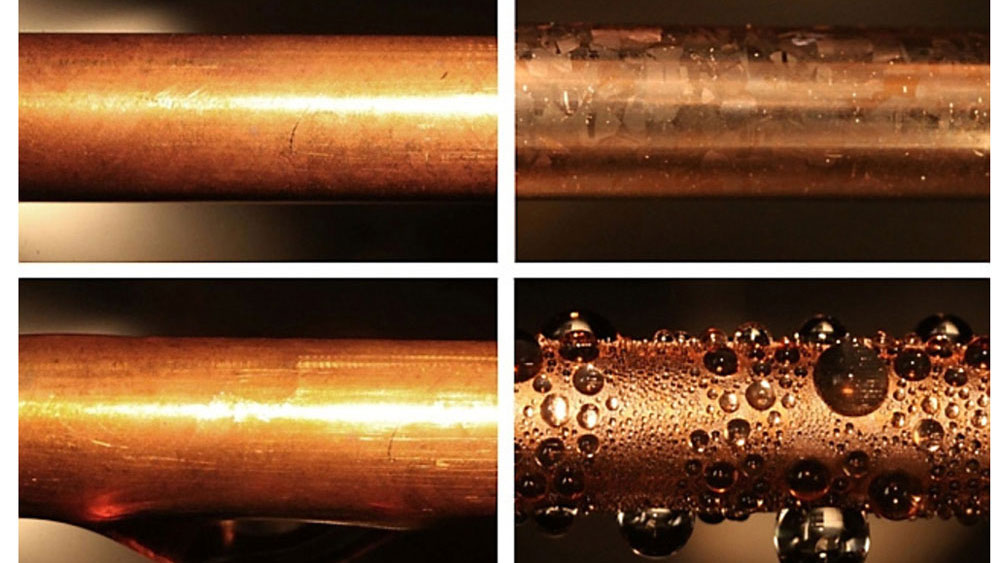
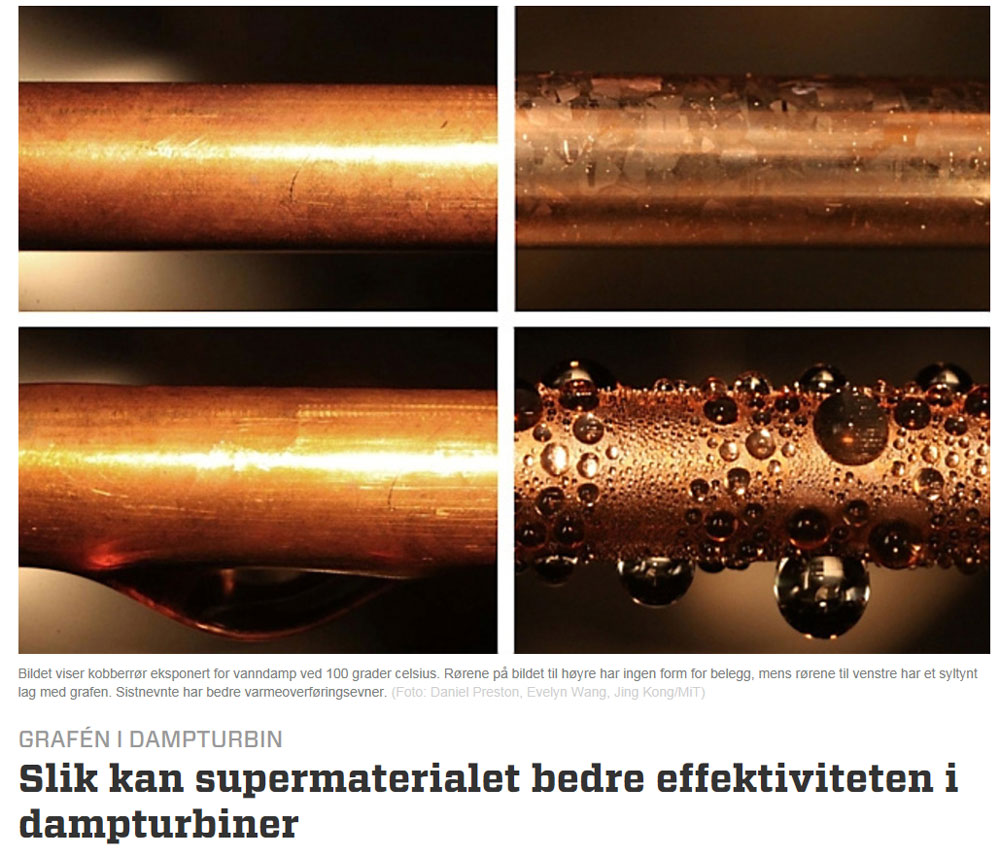
Researchers at MIT developed in 2015 a method for coating heat exchangers in steam cycles with graphene to dramatically improve heat transfer properties. This will lead an efficiency improvement of 3 percent in power plants which means significant reductions on a global scale.

COMPACTS researchers were interviewed to estimate the significance of the invention for Norway and discusses the potential of utilizing graphene for offshore sea water condensers that are part of the bottoming cycle. However, these are made of titanium offshore due to utilizing sea water for cooling instead of tap water so it is not as straightforward.

Read the full article – in Norwegian

Comments

No comments yet. Be the first to comment!

Leave a comment Cancel reply

Your email address will not be published. Required fields are marked *

More about Energy

How much can energy-efficient voyage planning save? Evidence from 11 months of North Atlantic data

Author Image
Author Image
2 forfattere
Infographic showing the flow of thermal energy storage (TES) from surplus heat or cold to end users. On the left, red and blue thermometer icons represent surplus heat and cooling, accompanied by the text “Surplus heat or cold – Captured and stored for when it’s needed.” In the centre, a large panel titled “Thermal Energy Storage (TES)” presents three storage technologies. The top section, “Sensible TES,” shows a container with a thermometer and the text “Stores heat in one single phase.” The middle section, “Latent TES,” shows a water droplet and snowflake connected by circular arrows, with the text “Stores heat through phase change.” The bottom section, “Thermochemical TES,” shows two connected coloured circles that separate and reconnect, illustrating a reversible reaction, with the text “Stores heat through reversible reactions.” A large pale arrow-shaped wedge points from the TES panel toward the right side of the figure. On the right, three application areas are shown in separate boxes with icons: industrial processes, buildings, and data centres. The layout conveys that surplus heat or cold can be stored using sensible, latent, or thermochemical TES technologies and later supplied to industrial facilities, buildings, and data centres.

Thermal energy storage is already commercial  

Jorge Salgado Beceiro
Research Manager

Burning ammonia cleanly: How timing changes everything 

Author Image
Author Image
2 forfattere

Technology for a better society

  • About this blog
  • How to write a science blog
  • Sign up for our newsletter
  • News from NTNU and SINTEF
  • Facebook
Gå til SINTEF.no
SINTEF logo
© 2026 SINTEF Foundation
Privacy Editorial Press contacts Website by Headspin