Experimental work
Recently, all partners in GAFT were updated about delays in SP2 due to challenges related to process control and safety systems. The deliverables related to SP2 are still planned to be delivered in the current year.
Work have been concentrated lately on testing the functionality of subsystems such as the syngas burner. Also in preparation for the experimental campaign that is planned after the summer, all the gas analytical equipment have been tested and moved to the SINTEF Energy lab in Blaklia.
The gas lines for taking continuous measurements for the quantification of gas and particle concentrations have been designed and all the parts have been purchased. For the particle measurements by the ELPI (Electrical Low Pressure Impactor), the line will be actively heated in order to avoid condensation, which can lead to errors in counting particles.
HSE for the gas lines has been performed and will include purging the entire line with nitrogen and gas dilution with nitrogen for the ELPI line in order to avoid the risk of spontaneous ignitions inside the ELPI. The lines will be built and tested before the start of the summer vacation.
Modelling
Pulverized biomass particles are usually non-spherical but most CFD simulations treat them as spheres. This simplified assumption can lead to significant differences in simulation results compared to the real situation since drag forces of non-spheres are different from spheres and particle rotational effects should be included for simulations with non-spheres. The hypothesis is that when using spheroids, instead of spheres, to model pulverized biomass particles, CFD simulations will produce different particle trajectories and conversion histories.
In this regard, a new model that treats pulverized biomass particles as spheroids is implemented into OpenFOAM (Open Source Computational Fluid Dynamics Toolbox). In this model, particle drag force and torque are modified. The implementation of spheroidal torque is validated with DNS data from Lihao Zhao (NTNU, Tsinghua University). Whereas, the implementation of spheroidal drag force is validated by comparing with the terminal velocity of spherical particle.
Results
Preliminary result (see the figure below) shows that spheroidal particles have different trajectories in comparison to spherical particles. Furthermore, particle initial orientation and aspect ratio play a role in altering particle trajectories. These results have been presented at the “Sixteenth International Conference on Numerical Combustion” in Orlando, which took place on 3-5 April 2017.
In additional to research, the PhD candidate has taken two educational courses and one training course this spring (Heat and Combustion Technology and Advanced Computational Fluid Dynamics, and Open Source CFD for industry – high-level development).
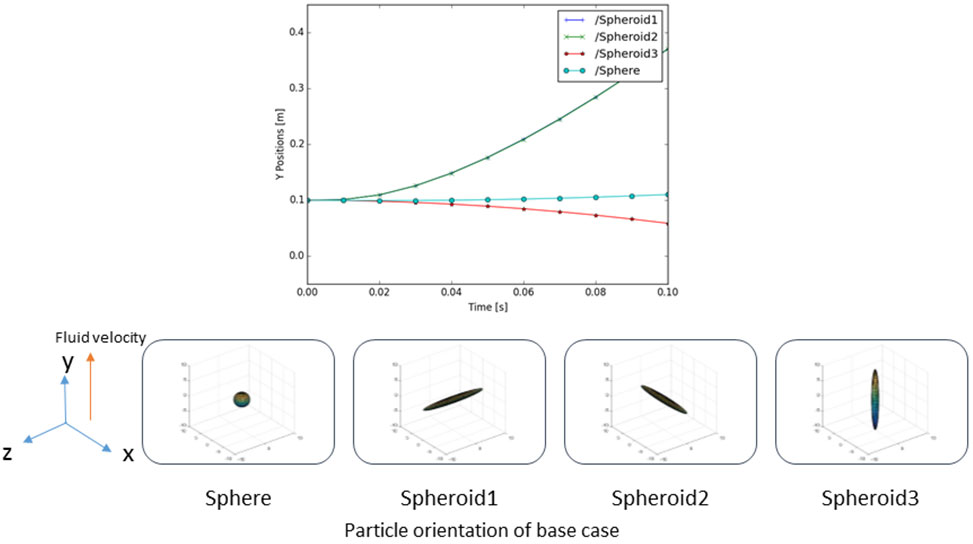
(Source: Guo, Ning; Li, Tian; Løvås, Terese (2017). Eulerian-Lagrangian Simulation of Non-Spherical Biomass Particles in Turbulent Flow. Sixteenth International Conference on Numerical Combustion, Orlando, Florida.)


Comments
No comments yet. Be the first to comment!