The NORDICCS project is a collaborative research project between leading CCS research institutions in the five Nordic countries. Together we have developed a “roadmap” for CCS.
A workshop on updates for the NORDICCS CCS roadmap was held at Gardemoen on January 28th, 2015. The topic for the workshop was to discuss what cases should be included in the update of the NORDICCS CCS Roadmap which is due to be published in November 2015 and presented at the final NORDICCS dissemination event on November 12th, 2015.
The workshop was well attended with 16 participants from all the five countries and members of NORDICCS including Gassco, SINTEF, Tel-Tek, University of Oslo, all Norway, University of Iceland, Chalmers and IVL, Sweden, GEUS, Denmark and VTT, Finland.
What cases will be included in new edition of the Nordic CCS Roadmap?
In the first version of the NORDICCS roadmap there were several cases.
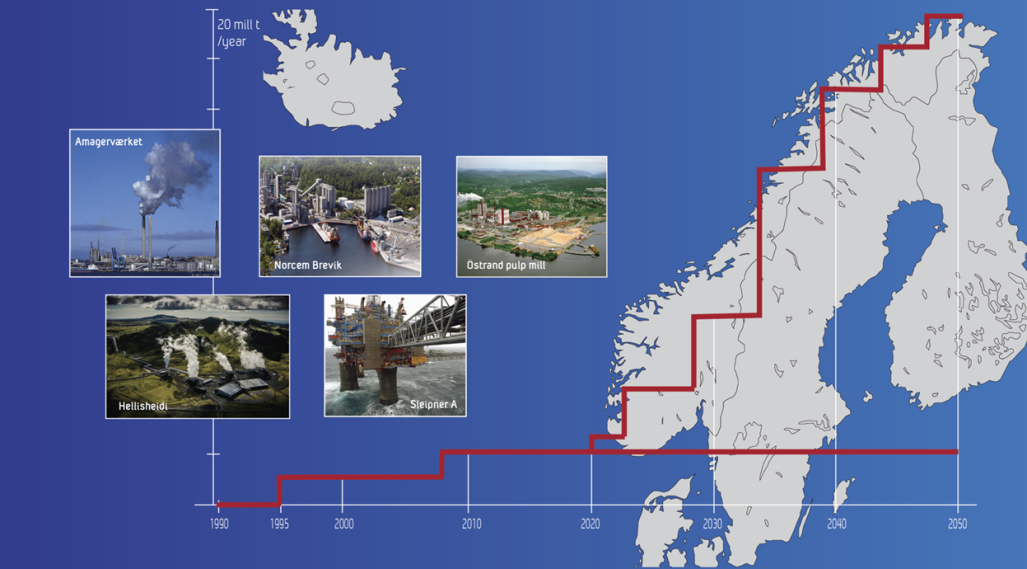
The updated version will only contain 6 cases that have been the topic of detailed study by all the WPs in the NORDICCS project over the last 4 years. These will be:
- Natural gas sweetening (i.e. removing CO2 from natural gas before it is exported)
- Skagerak cluster of cement, fertilizer, and chemical industry geographically positioned within the Skagerak area.
- Bay of Bothnia, large amount of point sources including a steel mill emitting 3.4 M tonnes of CO2 annually.
- Østrand pulp mill, Northern Sweden, emits 1.4 M tonnes of CO2
- Copenhagen, a coal/biogenic mixed fuel power plant which could be an early case with offshore storage and potentially EOR.
- Carbfix, Iceland: Reykjavik Energy is capturing all H2S and CO2 from one of their 6 turbine lines in their geothermal power plant.
In addition detailed calculation of costs of transport of CO2 will be added with focus on the following transport clusters: Norwegian North Sea, Skagerrak, Baltic Sea, e.g. (Utsira, Gassum and Hanstholm, Faludden; SW Iceland, Gedser). The cost per 100 km transported for 1 Mt-10 Mt CO2-100Mt. There will be a discussion of storage sites with reference to the Storage Atlas and a generic discussion on injectivity and ranking on what aquifers are the most mature- which ones should be chosen first.
A discussion on which Framework conditions are necessary for implementation of CCS will contain the following topics:
- New EU legislation: CO2 reduction of 40% by 2030
- Number of employees working at the industries in question
- Manually increase price of ETS
- Storage offshore
- CCS in context with renewables
The roadmap will conclude with recommendations for collaborative Nordic CCS demo projects and future research areas.


Comments
No comments yet. Be the first to comment!