
With a continuously growing aquaculture industry and increasingly limited fish-farming sites at close-to-shore areas both in Norway and worldwide, the need to develop fish farms suitable for aquaculture farming in typical offshore environments is increasing. For this purpose, SALMAR has developed and deployed the Ocean Farm 1 facility for offshore fish farming, as illustrated in Figure 1.
The Ocean Farm 1 structure is in and of itself innovative. In addition, with this work it’s the first time a systematic numerical model has been established and used to study the farm’s performance with waves and current. Similarly, it’s also the first time that the results of this structure’s model test are being published.
The Ocean Farm 1 structure was tested at SINTEF Ocean’s laboratory in 2014. Numerical modelling of the Ocean Farm 1 structure has also been carried out at SINTEF Ocean, to investigate the fish farm’s responses within a sea environment. With the developed numerical model, time domain simulations are performed to obtain the farm motion and mooring line tension. The simulation results are first validated against measured data. After the validation, numerical simulations are performed with various weather conditions involving irregular waves and currents. The obtained motion response of Ocean Farm 1 is presented here (Figures 4-6).
The established numerical model consists of Ocean Farm 1’s frame structure (with rigidly-connected circular column components), the net and the mooring system, and it works as follows. The hydrodynamic external loads and coefficients of the frame structure are obtained by using potential flow theory. The quadratic drag load on the individual circular columns of the frame structure is formulated by a given drag coefficient. The loads on the net are formulated by using the screen model, where the Reynold number dependent lift and drag forces are formulated as a function of the solidity ratio of the net, relative to the inflow angle and velocity. The hydrodynamic loads on the mooring lines are formulated using the Morison’s equation, and the structural responses of the mooring lines are obtained using a nonlinear FE model. A flow chart of the numerical modelling of the Ocean Farm 1 structure is shown in Figure 2.
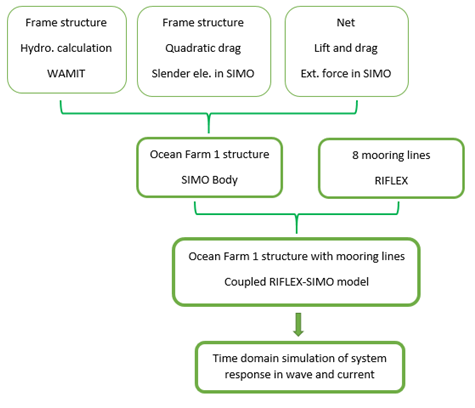
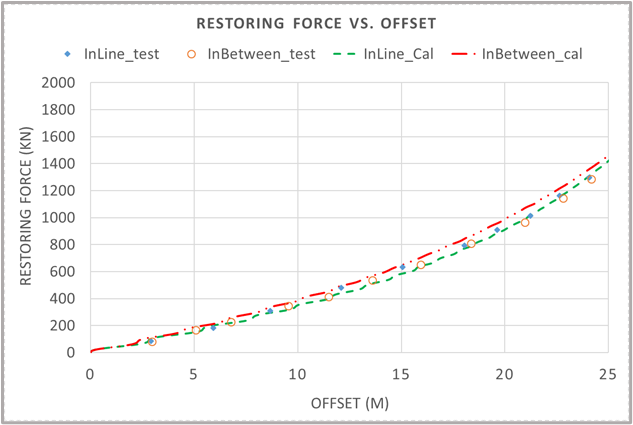
Figure 3 shows the mooring system’s restoring force vs. farm offset plot. Here, the calculated force-displacement behaviour agrees well with the measurement, which ensures a good agreement of the total mooring-restoring effect on the ocean farm motions. The two pulling directions give the same force-displacement behaviour, as the mooring line anchor positions are symmetrically arranged.
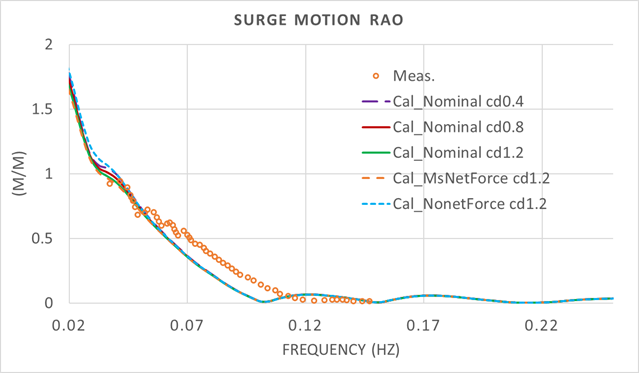
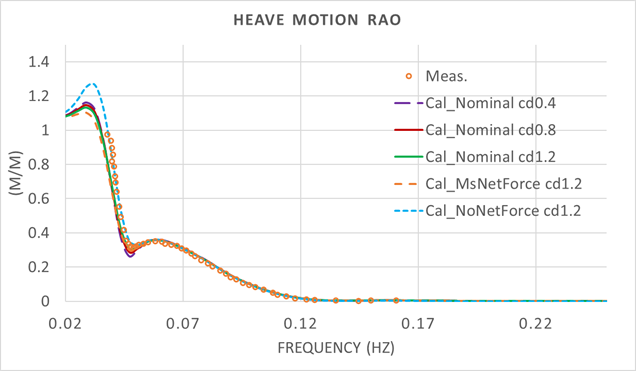
The farm structure’s motion transfer functions are formulated through a measured and calculated farm response in pink noise waves with a period range of 5s-25s. The measured and calculated motion Response Amplitude Operators (RAO) are compared in Figure 4-6. Here, we see that the predicted surge, heave and pitch RAOs are indeed close to the measured values. The RAO comparison indicates that the first-order wave frequency motion response of the ocean farm structure is dominated by the response of the frame structure, based on potential flow analysis. Including the net force and drag load onto the frame structure will mostly change the motion responses at their natural frequencies, but not the wave frequency motion responses.
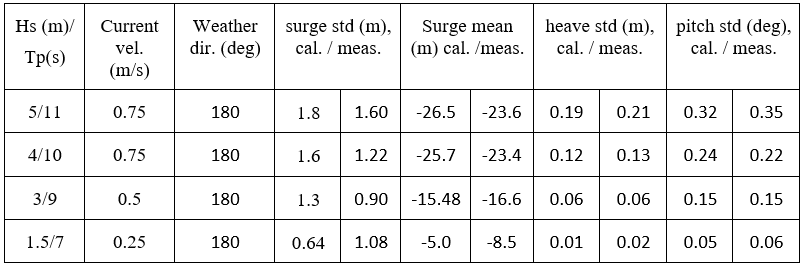
The motion response of the Ocean Farm 1 model in irregular waves and current is now being studied and compared with measurement data. Motion standard deviation of surge, heave and pitch motion, as well as mean surge motion is compared between numerical calculation and measurement for four sea states. This includes significant wave heights: Hs=1.5m, 3m, 4m and 5m. The comparison results are presented in Table 1, where we see a good agreement between calculation and measurement for heave and pitch motion. One major takeaway is that it seems that the damping for surge motion needs to be fine-tuned at different sea states in order to obtain good agreement between calculation and measurement.
The development of this numerical model and the results it gives provides us with the opportunity to begin developing fish-farming sites offshore, as close-to-shore locations are getting harder to come by. The established numerical model captures the main motion characteristics of the Ocean Farm 1 structure in waves and current, in terms of motion standard deviation and dominating response frequencies. The numerically-predicted motion performance of the Ocean Farm 1 is then systematically compared with measurement data and reasonable agreement is obtained. This knowledge helps us to understand the structure’s behaviour in the field, and to make adjustments where necessary to improve performance.

The developed numerical model currently being tested with Ocean Farm 1 can be integrated into an on-site farm-performance monitoring system, and it can also be used to develop a simulation tool for typical marine operations at the farm site. Working with weather forecast data, this modelling can predict operational performance, ultimately resulting in increased operational safety and efficiency.
Contributions from this blog post by Jingzhe Jin (research scientist), Biao Su (research scientist), Nuno Fonseca (senior resesarch scientist) and Ivar Nygaard (senior project leader), all from SINTEF Ocean.
0 comments on “Numerical modelling with the Ocean Farm 1 structure”