
Norway’s first offshore wind auction was successfully completed under an agreement where the state guarantees a stable price for the developers. The total subsidy limit is at NOK 23 billion. How will this work and how long will it take to reach the limit? We did the math for you.
The recent auction for the licence to build offshore wind farms in the Sørlige Nordsjø II area was successfully completed on 20 March 2024. The contract was awarded to Ventyr, owned by Parkwind (51%) and Ingka (49%), at a price of 115 øre/kWh (known as the “strike price”). According to the terms of the agreement, the wind farm operator will sell the generated power to the spot market. If the spot price is lower than the strike price, the state will pay the difference to the developer. If the spot price is higher than the strike price, the developer will give the surplus to the state. This is known as a two-sided Contract for Difference (CfD) – a common subsidy mechanism for renewable energy.
As an example, if the spot price is 100 øre/kWh and the wind farm produced 1000 MWh during that hour, the wind farm operator would get a revenue from the spot market of 1 MNOK. However, given a CfD with a strike price of 115 øre/kWh, the wind farm operator will get the difference (115 – 100 = 15 øre/kWh), in subsidies from the state. In this case 0.15 MNOK for the given hour, bringing the operator’s total revenue for that hour to 1.15 MNOK.
If the spot price is above the strike price, for example 150 øre/kWh, the wind farm operator will get a revenue from the spot market of 1.5 MNOK, but have to pay the difference back to the state (150 – 115 = 35 øre/kWh), which in this case amounts to 0.35 MNOK. This will make the wind farm operator’s revenue 1.15 MNOK for 1000 MWh of production; the same amount as for the previous case.
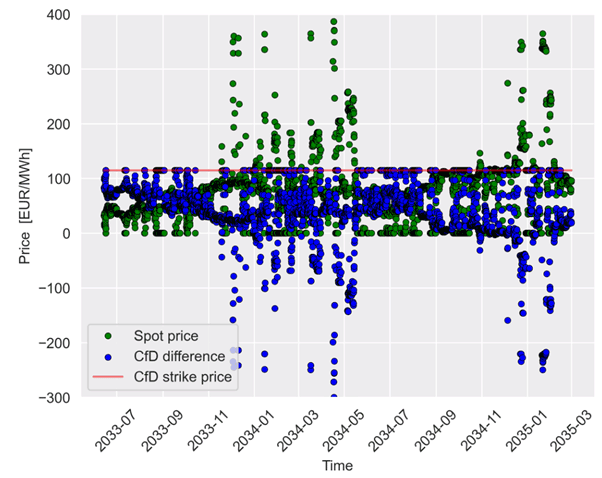
The revenue for the wind farm operator will thus be independent of the spot price and just dependent on how much the operator produces at any given time. This is the de-risking nature of the two-sided CfD. The relationship between the spot price and the CfD price is illustrated in Figure 1, where the green dots illustrate a simulated spot price and the blue dots illustrate the resulting effect on the CfD-subsidies. The faded red line is the strike price of 115 øre/kWh. The plot is for a simulated power price time series for a potential future offshore bidding zone named NO-S-OWP. The power prices are selected from a power system simulation of potential future offshore bidding zones. The simulations have been performed using the power market simulation tools developed by SINTEF Energy Research, and the input data is based on ENTSO-e TYNDP, Statnett and NVE for a 2040 scenario for the European power system. In this given simulation, the SNII offshore wind farm is radially connected to NO2.
For the purpose of these calculations and for simplicity, the EUR/NOK exchange rate was set at 10 NOK for 1 EUR, which gives us a strike price of 115 EUR/MWh. As can be seen from Figure 1, the power price is sometimes below 115 EUR/MWh, and thus the CfD-difference is positive (the operator receives subsidies from the state). At times, the spot price is higher than 115 EUR/MWh, and then the CfD-difference is negative (thus the operator “pays back” subsidies to the state).
The auction won by Ventyr has the condition that the subsidies are limited to 23 billion NOK, and that the installed capacity will not exceed 1500 MW. It is therefore interesting to look at the revenue stream for such an installation in an offshore bidding zone for a future scenario. Note that both the subsidies limitation and the price in reality should be adjusted with a price index. In order to keep the example simple, this is not included in the calculations.
Based on these simulations, the subsidy limit will be reached after about 6.5 years of operations.
Based on an installed capacity of 1500 MW, production series have been calculated for this wind farm based on wind data from ERA5. It is important that the wind series that is used to generate the production series is the same as the one used for the price simulations as there are strong correlations between the two. The power price in a future power system dominated by wind and solar power will have price fluctuations that typically lead to lower power prices when there is a large production from these sources. In general, the price the offshore wind farm operator achieves for its production will be lower than the average power price for that area. Therefore, the production series and the price series need to come from a consistent source and have sufficiently high resolution. The utilisation of average prices over longer time periods would give large errors in the revenue estimates.
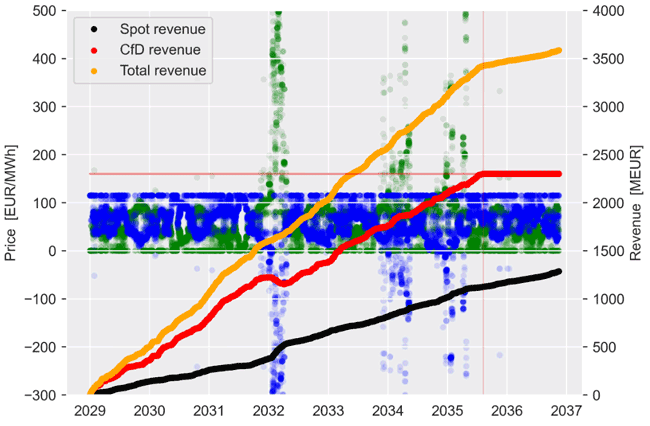
In Figure 2, the simulated prices for the potential future offshore bidding zone NO-S-OWP are given for several years. These are based on historical chronological weather years, but production is assumed to commence on 1 January 2029 with an installed capacity of 1500 MW.
The black curve shows revenue from the spot market on a 3-hourly basis. Note that the simulated prices are all positive, and thus there is a constantly increasing cumulative revenue stream from the spot market. The red curve shows the revenue from the CfD-difference discussed above. As explained before, this difference may be positive or negative. Hence, the cumulative revenue stream from the CfD is negative at time intervals where the spot price is above the strike price of 115 EUR/MWh and the wind farm operator “pays back” the subsidies. However, the trend is that the revenue from the CfD is largely positive, with the strike price exceeding the spot price. The orange line shows the combined revenue for the offshore wind farm operator (sum of CfD and spot). As stated above, the total subsidies are limited to 23 billion NOK, or 2 300 MEUR according to the exchange rate we set earlier. After this time, no more subsidies will be paid out to the wind farm operator, and the operator will likewise no longer have to pay back any excess spot market revenue.
Based on these simulations, the subsidy limit will be reached after about 6.5 years of operations. There are of course large uncertainties in this estimate. Absolute future power prices, their fluctuations and future production are hard to estimate accurately. Regardless, the expectation is that the operator’s revenue will drop within that approximate time frame, due to reaching the limit of the subsidies. Furthermore, it is expected that the wind farm operator will enter some sort of long-term power purchasing agreement. The price for this agreement will most likely be based on the parties expected future spot price, and therefore the spot price-based analysis still holds relevance for estimating future revenue streams.
In conclusion, this simplified example shows how the auction results from SNII may play out for an offshore operator, and indicates a potential time horizon for the spending of the subsidies allocated. As mentioned, the index adjustments of these numbers have been ignored. This, in addition to the uncertainty in the price and production forecasts, may influence the resulting numbers. But this numerical example illustrates realistic time frames and scales of revenues for a potential future offshore wind farm.
0 comments on “Sørlige Nordsjø II auction: How long will 23 billion NOK last?”