

CO-AUTHOR: Richard Schmitz
The HydroConnect project and its motivation
The HydroConnect project analyses the impact of hydropower on the EU’s goal to reach net-zero emissions, electricity prices in Norway and Europe, and the environment of Norwegian reservoirs and rivers, based on different European scenarios for power system and interconnector development by 2030 and 2050. As a first step in the project’s chain of modelling tools, Fraunhofer IEE’s SCOPE Scenario Development modelling and optimisation framework (SCOPE SD ) is used to compute relevant future scenarios for Norwegian hydropower. To analyse its role in future European energy scenarios, a detailed hydropower model for the multi-reservoir hydro systems is employed. Several scenario variants that reflect essential future uncertainties are also investigated.
The representation of multi-reservoir hydropower systems across Europe is based on Fraunhofer IEE’s internal database, which contains hydropower plants from and reservoir parameters of over 850 hydro systems, with more than 2,840 single hydro plants and 3,600 individual hydro reservoirs gathered from public data. Besides plant- and reservoir-specific data, the database includes complex hydraulic connections and couplings, as well as information on cross-border market participation. The parameters of hydropower systems in Norway were updated in close consultation with SINTEF, based on their detailed models.
HydroConnect’s scenario streams and European scenario variants
The following figure depicts an overview of the analysed scenario streams and European scenarios investigated by the HydroConnect project. Note that a pan-European SCOPE SD simulation has been carried out for each of the 15 scenario combinations indicated below.
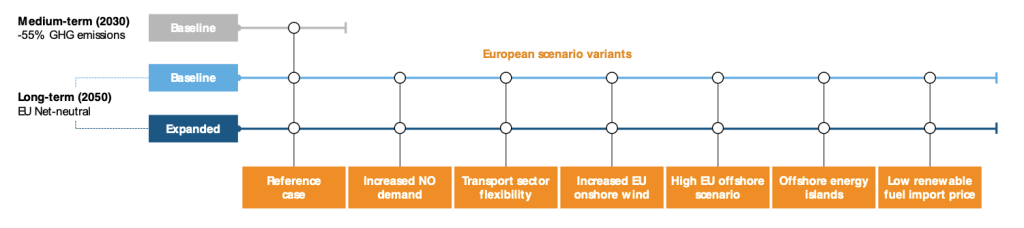
In a medium-term scenario developed for 2030, greenhouse gas (GHG) emissions are reduced by 55 per cent compared to 1990. The medium-term scenario primarily highlights the intermediate effects on the energy and power system in transition to climate neutrality by 2050. In the long-term scenarios for 2050, Europe is modelled as a net-neutral system. This implies that less GHG emissions are being produced than absorbed by the system.
Note that two different scenario streams are defined for all European scenarios: Baseline and Expanded. The main difference between the two is that the Expanded cases assume an additional Norwegian hydropower turbine capacity of 11.2 GWel (5.2 GWel of pump capacity) and an increased interconnector cable capacity of 13 GWel for cross-border electricity exchange flows to and from Norway.
Based on a “reference case” for each of the scenario streams, a range of European scenarios were investigated:
- Increased Norwegian electricity demand (↑ NO demand): the increase in electricity consumption for Norwegian data centres and new consumers (42 TWhel/yr) is twice that of the reference case (21 TWhel/yr),
- Reduced transport sector flexibility (↓ Transport flex): the share of flexible vehicle charging behaviour for electric vehicles in all considered market areas is only 20% 80% in the reference case,
- Increased onshore wind deployments (↑ EU Onshore): a higher public acceptance of onshore wind in Norway and Europe leads to increased expansion potentials compared to the reference case, i.e. 1,228 vs. 908 GWel at the pan-European level, and 22 vs. 10 GWel in Norway,
- Increased offshore wind deployments (↑ EU Offshore): there is a pan-European minimum offshore wind expansion of 446 vs. 284 GWel, and 20 vs. 6 GWel in Norway,
- Increased offshore wind deployments plus offshore energy islands (↑ EU Offshore+OEI): corresponds to the ↑ EU Offshore variant with the exception of two offshore energy islands at the Doggerbank (not connected to Norway) and in the Danish EEZ (connected to Norway), and
- Increased use of renewable hydrogen imports (↑ EU H2 Imports): the import price for renewable hydrogen from global markets is cheaper at 73 EUR/MWhth, compared to 85 EUR/MWhth in the reference case.
Norway’s electricity balance depends on domestic wind expansions and electrolysers
The figure below shows Norway’s electricity balance for the HydroConnect Baseline and Expanded cases. The electricity consumption indicates seven categories: conventional domestic consumption, data centres and new consumers, industry, petroleum, transport, electrolysers, and net export. Note that the demands of transport and industry, as well as conventional domestic consumption, are assumed to be constant for all considered model runs. The assumptions are in line with recent studies from the Norwegian Water Resources and Energy Directorate (NVE), Statnett, and Energinet.
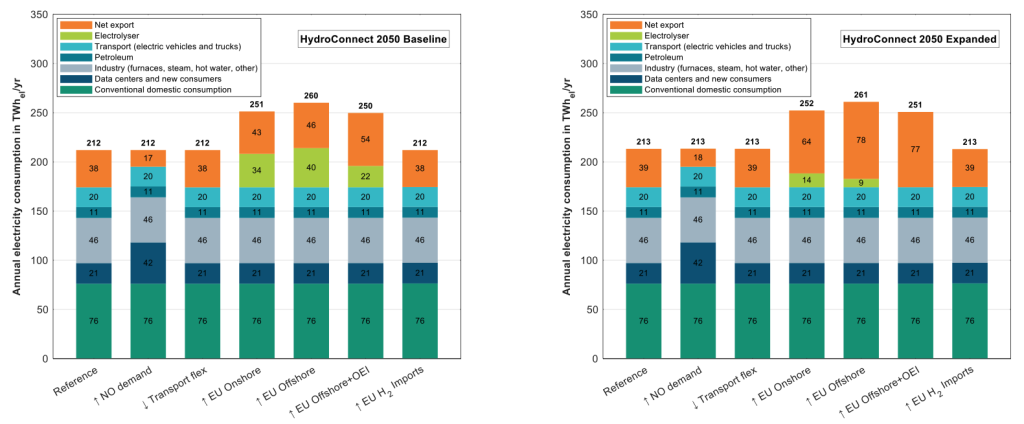
The most considerable changes in Norway’s electricity balance result from changes in the cross-border electricity exchange and the expansion of domestic electrolyser capacity for hydrogen production. The scenario with increased electricity consumption shows that a substantial increase in electrical demand for new consumers directly translates into a reduction of net exports from Norway to its power system neighbours.
The scenarios with reduced transport sector flexibility and lower import prices for hydrogen imports do not show significant changes for Norway compared to the reference case. However, the scenarios with more onshore and offshore wind deployments in Norway lead to an expansion of domestic electrolyser capacity. When comparing the Baseline and Expanded cases, the market clearing outcomes further show that exporting the additional electricity production from domestic wind power plants via interconnector cables is more favourable than producing hydrogen.
Norway continues to be a net exporter of electricity
The import and export balances in the figure below show a breakdown of Norway’s resulting net exports. Norway has connections to Sweden, the Netherlands, Great Britain, Finland, Denmark, Germany, and the Danish Offshore Energy Island (OEI).
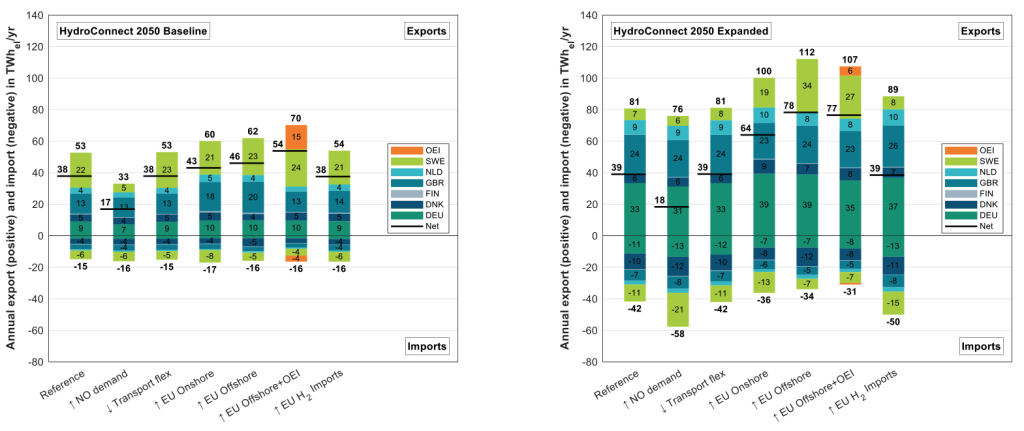
Ranging from 18 to 78 TWhel/yr, net exports are predictably higher for the Expanded cases when compared to 17 to 54 TWhel/yr in the Baseline cases. Moreover, Norway has the most significant net exports when domestic wind power is deployed. The lowest net exports occur if Norway’s non-flexible domestic electricity consumption increases. While most electricity is exported to Sweden and Great Britain in the Baseline cases, additional interconnector cable capacities in the Expanded cases primarily increase exports to and, less so, imports from Germany.
Net hydropower production in Norway remains in high demand and at stable levels
The next figure shows Norway’s hydropower production and consumption for all considered cases.
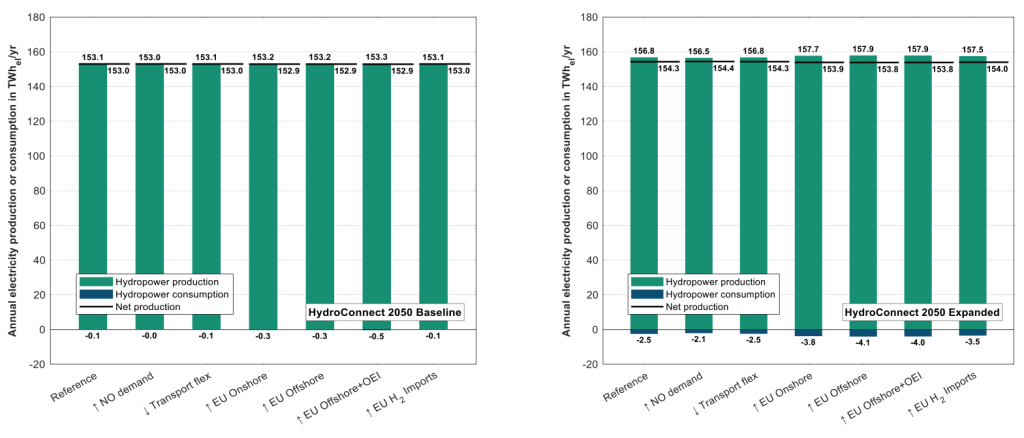
The difference in electricity production from hydropower is very small in the Baseline cases, with almost no electricity consumption via the pumped storage facilities. However, in the Expanded cases, additional pump and turbine units lead to increased hydropower production and consumption, although the net electricity production remains at similar levels when comparing both scenario streams. Furthermore, Norwegian hydropower pumping volumes are at their highest levels with more wind power deployments in Norway and other parts of Europe.
The impact on Norway reservoir filling levels is substantial and depends on the scenario
The following figure shows the impact of Norway’s hydropower storage level for all considered cases.
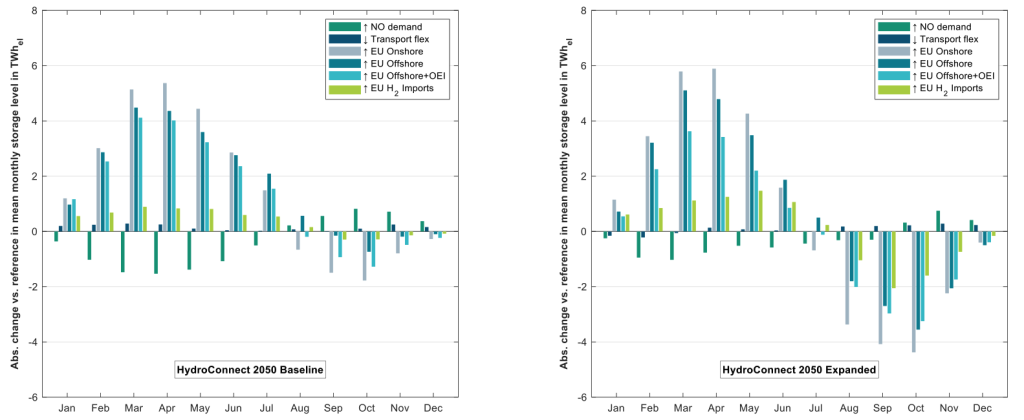
The European scenario impacts the storage-level trajectories throughout the considered year. All other things being equal, larger wind power deployments in Norway and Europe lead to higher reservoir filling levels (plus 6 TWhel) until summer for both scenario streams. Conversely, the increased Norwegian demand scenario exhibits lower reservoir filling levels. The opposite yet milder effect can be observed for the second half of the year. Lower reservoir filling levels in the second half of the year are more pronounced for the Expanded cases. This is mainly due to additional pumping and cross-border electricity exchange capacities.
Outlook for future work
One of the next immediate steps in the HydroConnect project is transferring the result data from the SCOPE SD modelling framework at Fraunhofer IEE to the downstream models at SINTEF and NTNU via the openENTRANCE nomenclature. In particular, output data from SCOPE SD will be used to analyse the use of Norwegian hydropower in even greater detail using the FanSI model.
With the established model setup and linkage, it is possible to investigate new sensitivities based on the reference cases. Given the current political debate, additional sensitivities concerning offshore energy islands or future hydrogen and e-fuel import price uncertainties could be interesting avenues for future research.


Comments
No comments yet. Be the first to comment!