


The advantages are the obvious economy of time, cars that require smaller batteries and the removal of wires. In theory, it’s possible to reach infinite range with this technology, but there are also several challenges. One of these challenges is that we don’t know enough about the consequences of such wireless charging on the power grid.
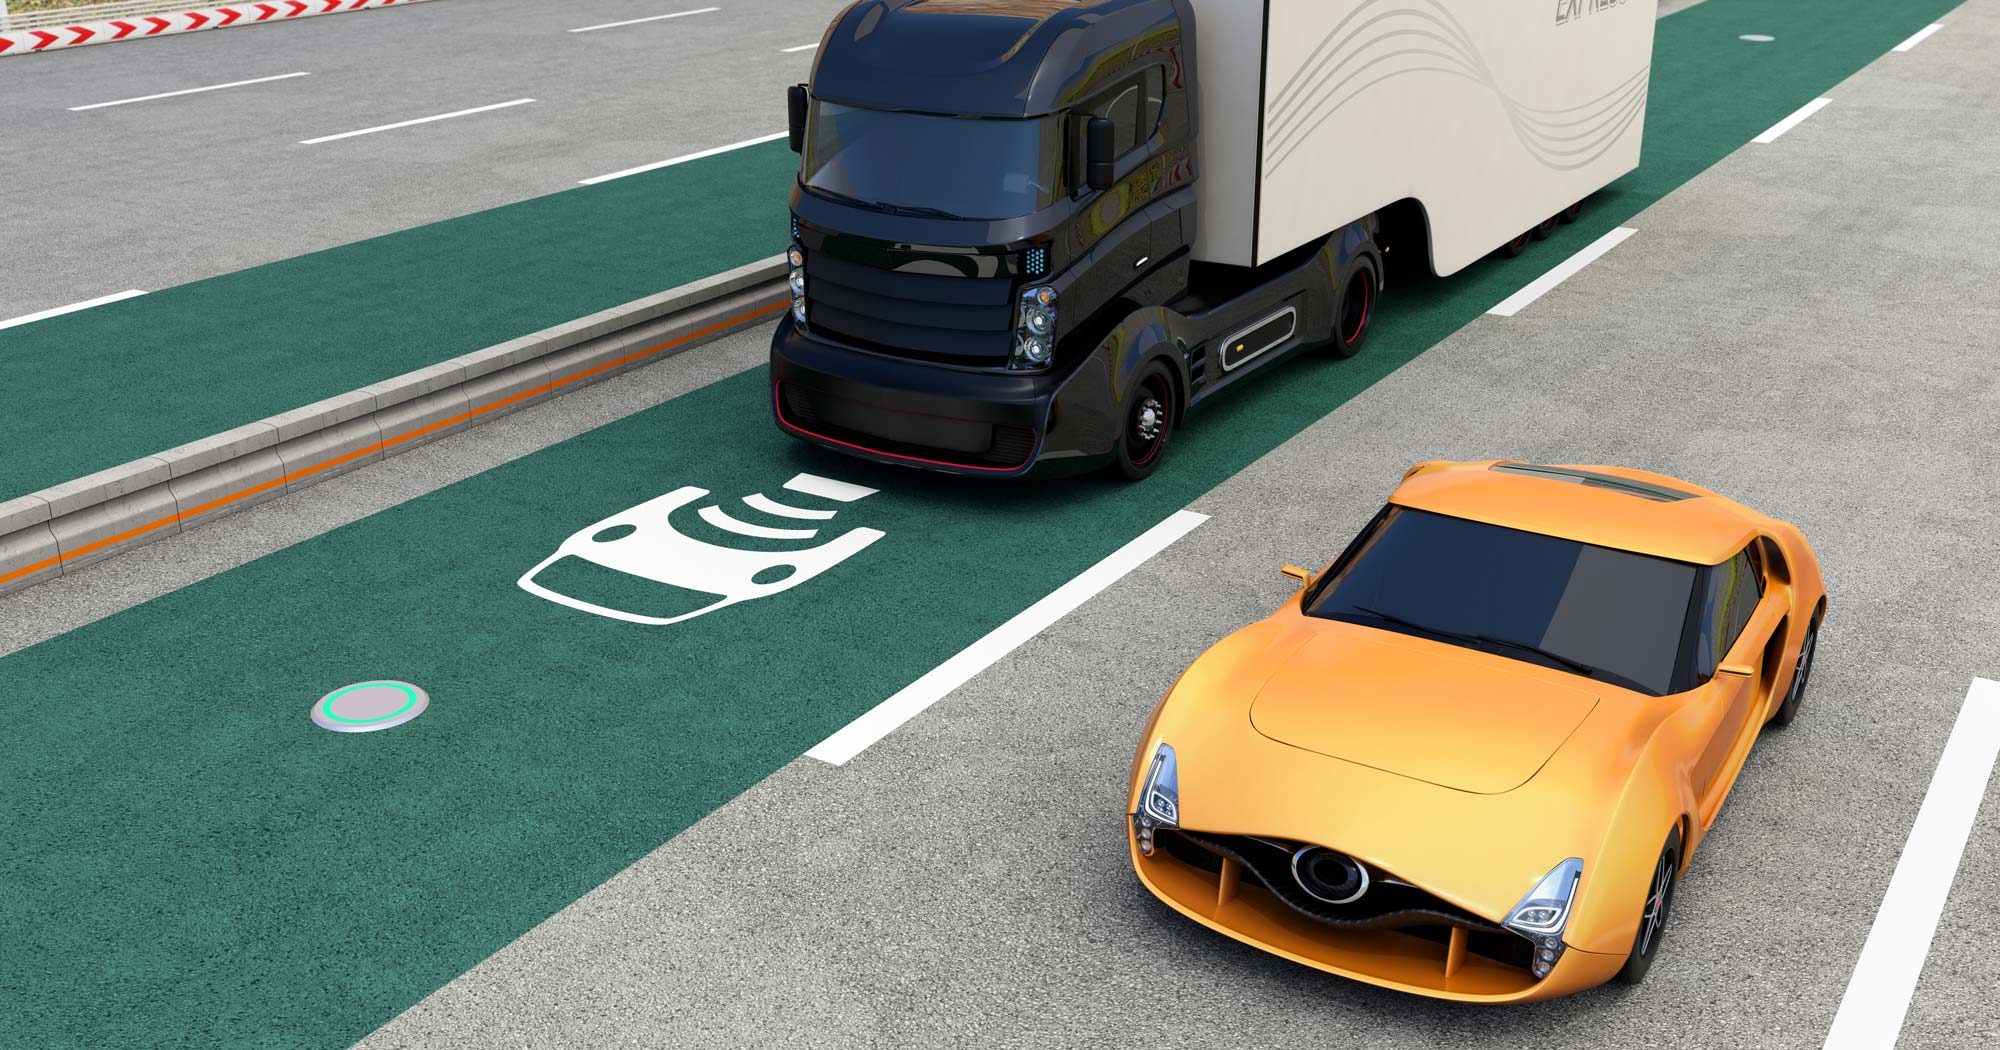
How does wireless dynamic charging affect the grid?
A report by the Institute of Transport Economics forecasts that most vehicles in Norway will be electric by 2050 – 99% of the short vehicles (under 5,6 meters), 98% of the medium vehicules (between 5,6 meters and 7,6 meters) and 75% of the long vehicles (above 7,6 meters). This will result in a dramatically increased strain on the power grid.
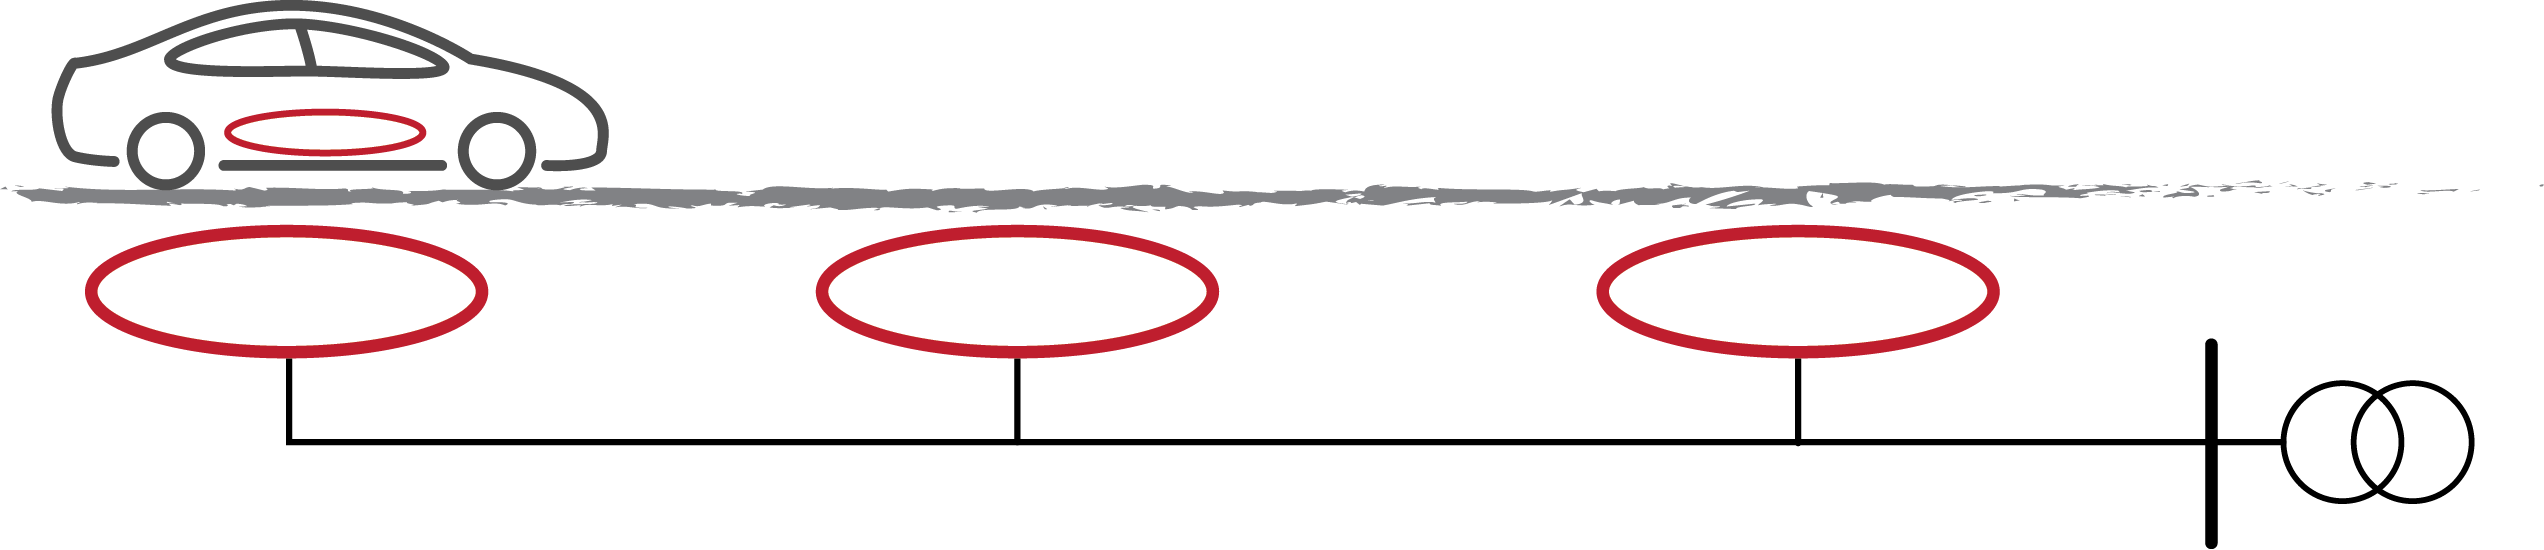
When charging happens while a vehicle is stationary, the vehicle is connected to a specific point in the grid. Dynamic charging, on the contrary, will be distributed over long distances and effectively be connected to several points in the grid.
Regardless of which charging methods become commonplace as electric car technology develops, we need to model and establish how the different solutions will impact the grid. In this way, we can ensure that we end up with the most socio-economic combination of charging solutions.
Research project FuChar – Grid and Charging Infrastructure of the Future – attempts to answer the question: how will a wireless dynamic charging system fall into place with the existing electric consumption in a given area?
To find out the answer, we studied a 6,5km long strech of road south of Lillehammer. The study showed that wireless dynamic charging in 2050 would result in a 6 MW increase in load on the distribution network. We also observed that the overlap between household consumption and wireless charging would be small, both throughout the day and throughout the year.
In other words: in the planning of the electric grid of the future, power demand from dynamic charging will need to be considered in combination with the existing power demand in the area, to ensure the grid isn’t overdimensioned. Such an approach will result in smaller investment costs, and a more socio-economic use of the grid.
How we worked with dynamic charging and household demand
In this study, we devised a method to aggregate the demand from wireless dynamic charging together with existing demand from households in the area. We focused on three research questions:
- How does the demand from wireless dynamic charging fall into place with the existing electric consumption in the area?
- How many MW should the power company expect wireless dynamic charging to require from the grid?
- Should variations in demand from wireless dynamic charging be evaluated together with variations in demand from households when establishing the capacity requirements for a given area?
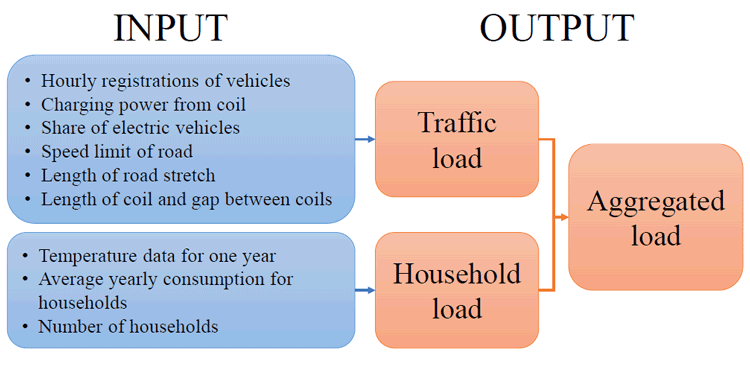
To create a load profile for wireless dynamic charging, we need data about the number of vehicles passing hourly, the charging power that can be transmitted by the coil, the portion of vehicles passing which are electric, the speed limit, the length of the road stretch, the length of the coils and the distance between the coils.
The power demand linked to wireless dynamic charging needs to include all types of land-based electric vehicles; not just cars. Household load profiles are created by using standard profiles, which need temperature data for the area, yearly average energy consumption and number of households. A more detailed explanation of the load profiles can be found in our scientific article: A proposed methodology for modelling the combined load of electric roads and households for long-term grid planning.
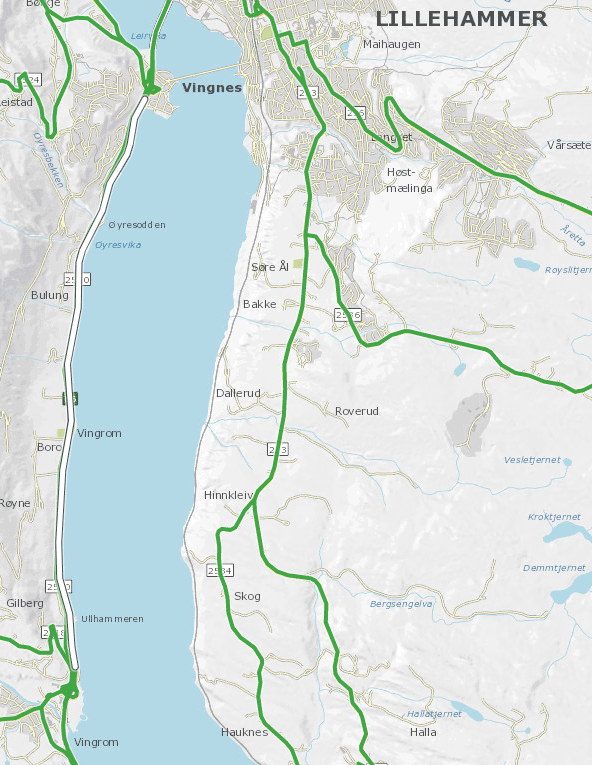
The method we used was a case study, where we assumed a 6,5km stretch of road on the E6 south of Lillehammer would be retrofitted for inductive charging (see illustration 2). We also assumed that all electric vehicles driving through the area would receive a charge of 40 kW. The area around the stretch of road has about 700 households.
The load profile for the electric vehicles was subdivided between short, medium and long vehicles based on numbers from NTP, and data from the Norwegian Public Roads Administration (Statens vegvesen) about the number of vehicles passing through the area during a year.
We ran simulations for 2025 and 2050, with different proportions of electric vehicles, but a similar household power demand.
How many MW would wireless dynamic charging require?
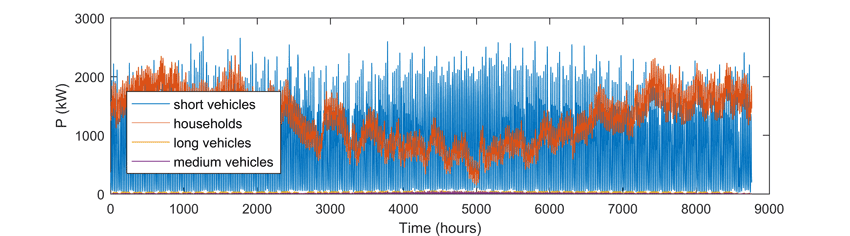
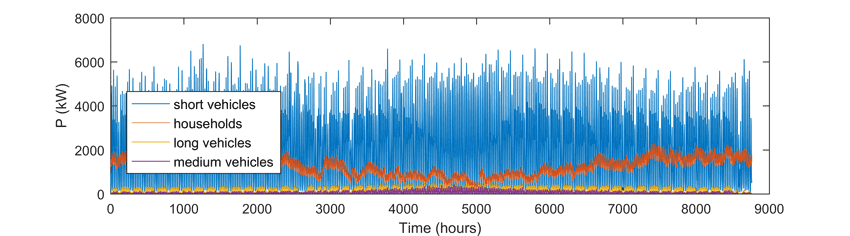
Illustrations 3 and 4 show the load profiles for a whole year in 2025 and 2050, if all vehicles driving on the road stretch get their batteries charged. Top demand for households was around 2 MW for both years. Short vehicles account for the lion’s share of the demand, since the proportion of short vehicles passing through that stretch of road is high. Top demand for short vehicles was at around 2,5 MW in 2025 and 7 MW in 2050.
How do the different loads correspond?
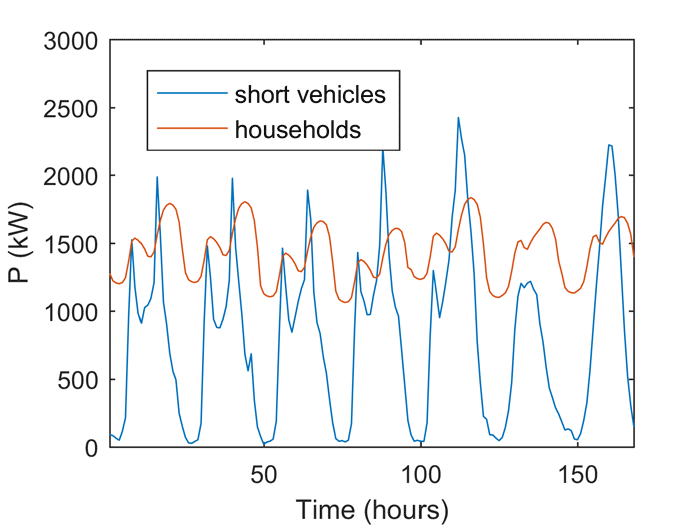
Illustration 5 shows how the household load varies compared to the load from short electric vehicles during a period of a week, in March. The two profiles have their peaks at different times of the day, and the weekly variation is also different.
The load factors that show how household load and inductive charging load vary throughout the year, relative to maximum load, is shown in illustration 6. Households have a high power demand in the winter because of heating, while the demand from wireless dynamic charging will be higher in the summer because there are more vehicles on the road at that time.
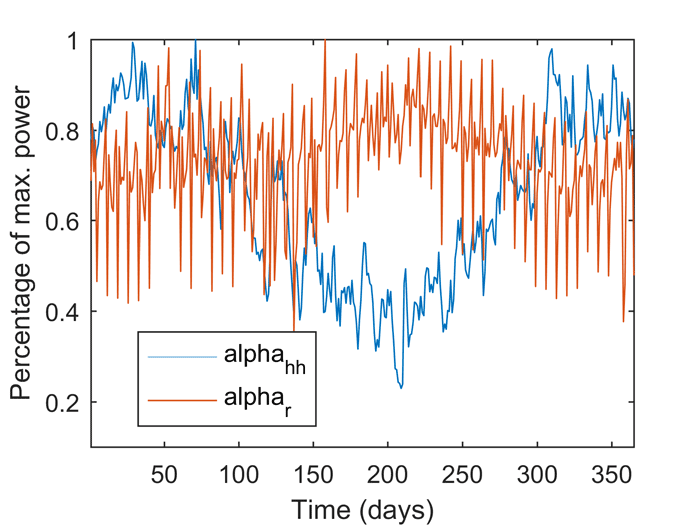
These are good news for the grid: when the maximum for the two different loads comes at different times, the grid is less strained than if they coincided. This variation should be taken into consideration when the power grid is scaled up for future wireless dynamic charging.
The way forward
Wireless dynamic charging as a technology is still in its demonstration phase, and it is uncertain to which degree it will be adopted in Norway. But the technology exists, and it is conceivable that it will become a part of the important solutions that will be required to meet the large charging infrastructure demand in the coming years.
There are however several points that need to be examined further before conclusions can be drawn:
- How will this service be priced?
- Should the vehicles themselves be allowed to decide if they want to charge or not?
- How high of a charging effect can we get from the coils in the future, and how small can the electric vehicle batteries become?
- What length of road will need to be retrofitted with this charging infrastructure, and how much will it cost compared to stationary charging stations?


Comments
No comments yet. Be the first to comment!