Skip to content

SINTEF Blog Gå til forsiden

  • Energy
  • Ocean
  • Digital
  • Health
  • Industry
  • Climate and environment
  • Building
  • Society
  • EN
  • NO
Energy

Review of analytics methods supporting Anomaly detection and Condition Based Maintenance – MonitorX

Comillas University has recently finished for the MonitorX project a review report on analytics methods supporting anomaly detection and Condition-Based Maintenance (CBM).

author
Thomas Welte
Published: 3. Jan 2017 | Last edited: 15. Apr 2025
2 min. reading
Comments (0)

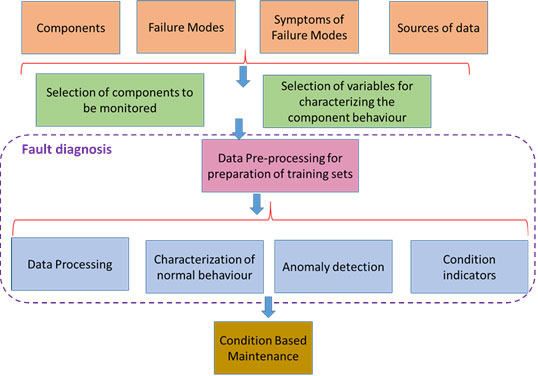
The report describes the main steps in the process from components, failures and condition monitoring data via fault diagnosis to CBM.

Report: Review of analytics methods supporting Anomaly detection and Condition Based Maintenance

The main structure of the report is illustrated in Figure 1.

Figure 1: Main structure of the report

The aim of condition-based maintenance is to carry out maintenance when the condition of the components indicated the need for maintenance. Intelligent analysis of condition monitoring data shall help to detect faults before they lead to breakdown of the components and to catastrophic failures.

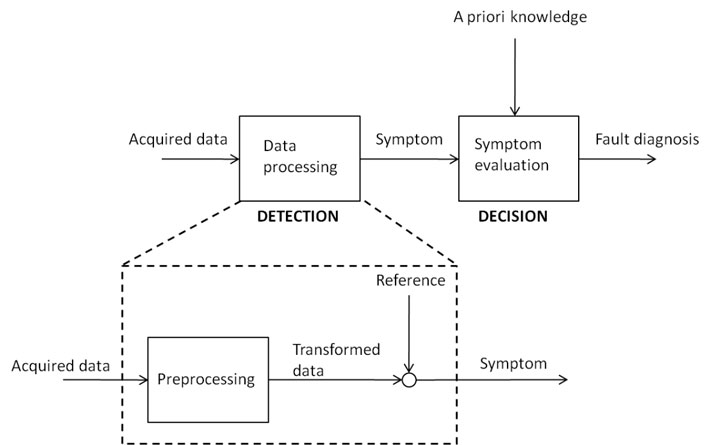
The aim of fault diagnosis is to determine the kind, size, location and time of a fault. Figure 3 shows a general scheme of the fault diagnosis process consisting of two main steps. The first step is performed by the fault detector whose task consists of acquiring data and elaborating proper information to be given for the second step. The outputs of the fault detector are called symptoms, i.e. information of the changes of an observable quantity from the normal behaviour. Therefore, the fault detector is a unit performing data processing in order to extract useful information about the fault it is detecting. A second step is required to complete the fault diagnosis. This second step consists of the decision as to whether or not a fault has occurred and determining the fault’s characteristics on the basis of the information processed by the fault detector and some a priori knowledge of the process such as deep knowledge of the physical processes involved and their general condition, operational and/or maintenance constraints or environmental considerations. What the decision system is supposed to realize is an automatic association between symptoms and faults.

Figure 2: General scheme of fault diagnosis

The report presents a brief overview of data pre-processing methods and a more comprehensive review of methods used for fault detection and fault diagnosis. Some of the methods described in the report and illustrated by a number of examples in the report are physical models, statistical models (principle components analysis, linear regression), neural network models (feedforward neural networks and self-organizing maps), models of data classifiers based on information entropy reduction (K-Means, hierarchical clustering, decision trees, support vector machines) and fuzzy models.

MonitorX project participants can find the complete report in the project Workspace

Comments

No comments yet. Be the first to comment!

Leave a comment Cancel reply

Your email address will not be published. Required fields are marked *

More about Energy

How much can energy-efficient voyage planning save? Evidence from 11 months of North Atlantic data

Author Image
Author Image
2 forfattere
Infographic showing the flow of thermal energy storage (TES) from surplus heat or cold to end users. On the left, red and blue thermometer icons represent surplus heat and cooling, accompanied by the text “Surplus heat or cold – Captured and stored for when it’s needed.” In the centre, a large panel titled “Thermal Energy Storage (TES)” presents three storage technologies. The top section, “Sensible TES,” shows a container with a thermometer and the text “Stores heat in one single phase.” The middle section, “Latent TES,” shows a water droplet and snowflake connected by circular arrows, with the text “Stores heat through phase change.” The bottom section, “Thermochemical TES,” shows two connected coloured circles that separate and reconnect, illustrating a reversible reaction, with the text “Stores heat through reversible reactions.” A large pale arrow-shaped wedge points from the TES panel toward the right side of the figure. On the right, three application areas are shown in separate boxes with icons: industrial processes, buildings, and data centres. The layout conveys that surplus heat or cold can be stored using sensible, latent, or thermochemical TES technologies and later supplied to industrial facilities, buildings, and data centres.

Thermal energy storage is already commercial  

Jorge Salgado Beceiro
Research Manager

Burning ammonia cleanly: How timing changes everything 

Author Image
Author Image
2 forfattere

Technology for a better society

  • About this blog
  • How to write a science blog
  • Sign up for our newsletter
  • News from NTNU and SINTEF
  • Facebook
Gå til SINTEF.no
SINTEF logo
© 2026 SINTEF Foundation
Privacy Editorial Press contacts Website by Headspin