One of the biggest challenges with the electrification of the transport sector is the large power requirement caused by fast charging, especially when combined with the unpredictability surrounding the time at which the vehicles are charged. This can lead to high power peaks from fast charging stations occurring at times where the grid is already dealing with high loads. Therefore, we must identify when the power peaks are occurring, and look at what measures we can take to adapt these to the capacity of the grid.
About FuChar
FuChar is a research project aiming at developing methods and tools for the optimal integration of charging infrastructure to the grid. The goal is to ensure that the transition to an all-electric transport sector happens in the most user-friendly and socio-economically sound manner.
About the author
I have had the pleasure of being a part of this project for a year and a half, first as a sommerforsker (summer researcher), then as a student and now as an “Energy Trainee“. In this article, I will outline some of the tasks I have been working on.
The charging situation today
To be able to predict and understand future charging needs, we need to gather as much information as possible about the situation as it is today. As a sommerforsker (I had a summer job as a researcher at SINTEF. How cool is that?!) my job was to analyse data from fast charging stations. One of my tasks was to investigate how the charging activity has evolved over the last three years – specifically in July 2019, 2020 and 2021 at the fast charging stations of a particular operator.
One thing is clear: electric vehicle use has risen significantly over the past years. The number of charging sessions has more than doubled from one year to another, such that in July of 2021, there were almost five times as many charging sessions as there were in July 2019. During the same period, the length of every charging session has shortened by around five minutes on average, as you can see in Table 1. In addition, the charging power and delivered energy have also dropped.
| 2019 | 2020 | 2021 | |
|---|---|---|---|
| Length of session | 29.8 min | 23.8 min | 25.3 min |
| Average power per session | 83.2 kWh/h | 88.5 kWh/h | 81.0 kWh/h |
| Energy delivered per session | 38.6 kWh | 33.3 kWh | 31.8 kWh |
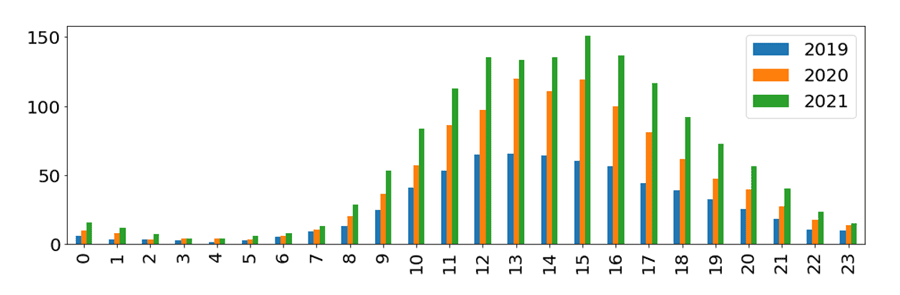
An important driver for the increase in the number of charging sessions is the Covid-19 pandemic. The number of Norwegians who vacationed in their own country the past two years increased compared to before. Figure 1 illustrates this by showing the estimated car traffic at one of the fast-charging stations that was investigated. It is clear that the number of electric vehicles has increased during those years.
Since the summer of 2020 vacation was for many the very first with an electric car, it is possible that range anxiety came into play. Maybe the people who chose to vacation with an electric car were those with the largest batteries, and therefore the largest charging power. In 2021, the charging power decreased significantly, which may be a sign that a larger portion of the electric cars on the roads were models using lower charging power. This could be because a number of less expensive electric cars came on the market. Another possibility is that people’s on-hand experience during the previous summer calmed their range anxiety. Either way, it’s interesting to note the numbers from 2020 and 2021, since they can provide a good indication of what the charging situation will be during a normal month in a few years.
What impact will electric trucks have on the grid?
That electric cars will dominate in the future is no secret. At the end of November, a whole 73.8% of all newly registered cars in Norway were electric. Electric cars now represent 14.8% of the total number for the entire country1. The number of electric vans and buses also increased.
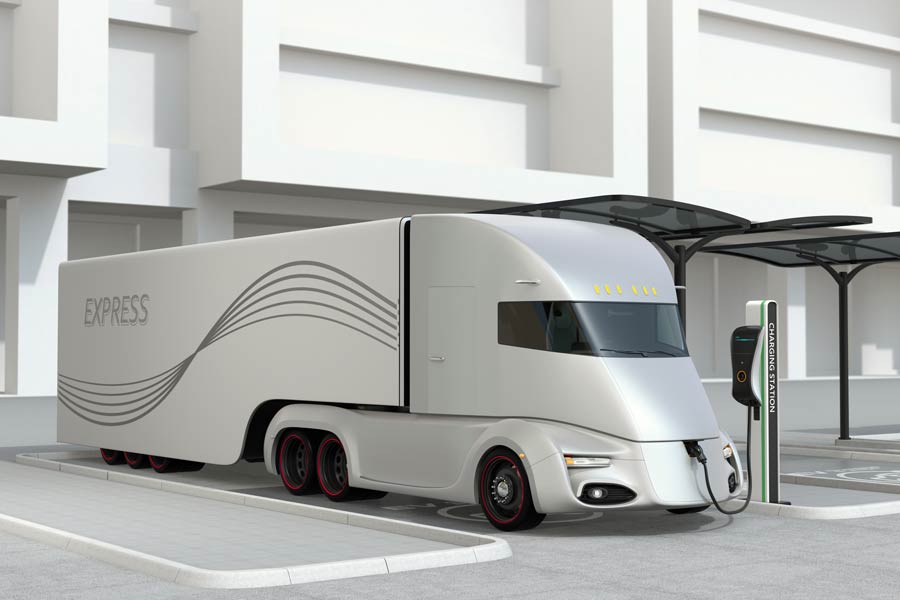
One vehicle group for which electrification is still at the development stage is heavy transport trucks. Right now, many manufacturers are working on designing electric alternatives. A good example is Tesla, who are working on their electric truck Tesla Semi. One of the big challenges of heavy transport is the large energy and power demand these vehicles have. The new trucks are expected to have batteries with capacities as big as 1000 kWh, and be able to charge with a power output of up to 1600 kW2. In comparison, the Audi e-Tron (one of the best-selling electric cars in Norway in 2021) has a battery of 85 kWh and can take a maximum power input of 150 kW3. In other words, the arrival of electric trucks means the introduction of large, power-intensive loads.
After completing my term as a summer researcher at SINTEF, I wrote a project assignment at NTNU as part of the FuChar project. There, I developed a model to create charging profiles for a fast-charging station that is projected to be used by heavy transport. This is a stochastic model where the arrival time for each vehicle is determined by a probability distribution that is based on the traffic flow in the area where the charging station is located. If the vehicle’s battery’s state of charge is under a certain level, it begins charging. Since professional drivers are required to have a break of 45 minutes after 4.5 hours of driving, the charging session is programmed to last as long as the driver’s break, or until the battery is fully charged.
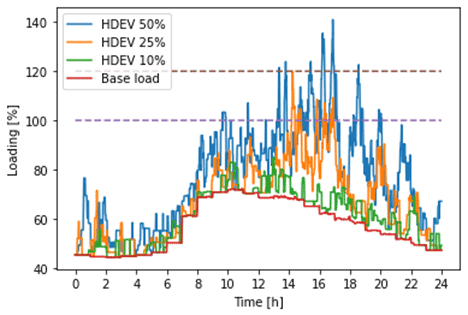
The results from this model were used in a case study investigating the impact of charging heavy transport trucks on the nearby power grid. The case study combined the load from the charging station with the already existing load in the area. Figure 2 shows that the electrical substation that serves the area can handle an 10% electrification of heavy transport, but that a 25% or 50% level of electrification of heavy transport would overload the substation – unless appropriate measures are implemented, like upgrading the substation.
The red line in the figure represents the power demand in the local area without heavy electric trucks. If you want to read more about this, you can take a look at the research paper based on the project assignment, which was published and presented at the SEST conference in September 20214.
Dynamic pricing and how it can become part of the solution for the charging infrastructure of the future
After modelling charging profiles for heavy transport, I took the research one step further in my master’s thesis, with a focus on operation and use of the charging stations5. As we have seen, electrification can result in high power peaks, especially for heavy transport. A desirable outcome would be to move or change these peaks, by leveraging the flexibility in both the power system and the drivers’ behaviour.
There are many charging station operators today, each with their own price structures. Some bill only for the amount of power delivered, while others also take into account the charging session’s length. The amount billed for each kWh or minute varies from one operator to another.
A common trait across all operators, on the other hand, is that their prices are the same regardless of where you charge your vehicle, or at what time of day. There is no change in price based on offer and demand (as is the case with electricity prices in Norway generally). As I described in the introduction, the available capacity of the grid varies according to the time of day. There are also differences in capacity from location to location. It would therefore be possible to leverage the grid’s capacity flexibility on a geographical basis, by having locations with good capacity fill a larger portion of the power demand for a given period. Using every charging station’s capacity in a more optimal way would have other benefits, such as reducing queues.
To make better use of the capacity of a given location, whether it’s a particular area on the grid or a particular charging station, we need to provide incentives to the drivers to move their charging sessions from a less optimal location to a more optimal one. Such an incentive could come in the form of dynamic pricing, where charging prices change according to the state of the grid at the given charging location. This can be done by raising the price at a charging station that is connected to a section of the grid with low capacity (low offer). This will make it more attractive for the drivers to change their route and use a different station.
As a master’s student, I developed a method to create the pricing signals intended to motivate the drivers to choose charging stations that leverage the grid’s flexibility. This method is based on solving the optimal power flow. This means distributing the available electricity to the grid in the best way possible given the existing restrictions, such as transmission capacity in power lines, load requirements at different locations, voltage level requirements and access to electrical energy.
This method makes it possible to determine what is called the node price, that is to say the cost of delivering the electricity to different locations (nodes) on the grid. Typically, this cost increases with the distance there is to cover, because of an increased loss of electrical energy on the way. By adjusting the charging price according to the node price, charging prices at a given charging station will better reflect the actual cost of delivering the electricity there. By determining the optimal power flow for every hour based on the load requirements on the grid – both from charging stations and local households – we will get a variable pricing profile throughout the day at the different locations.
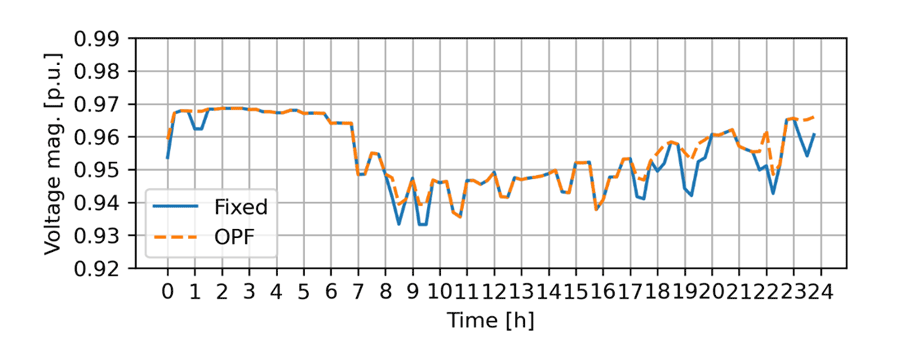
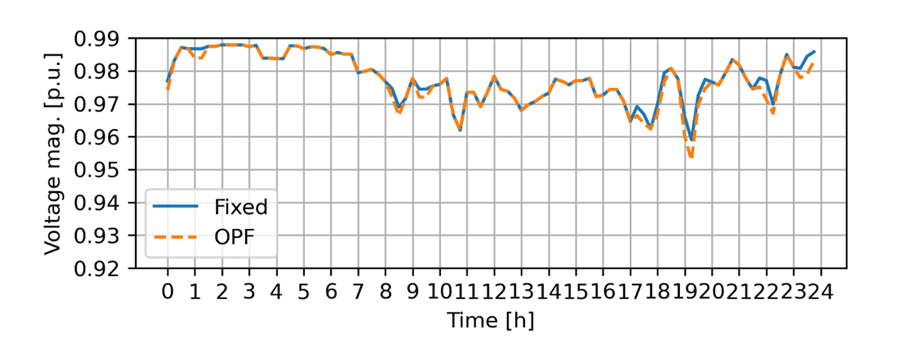
This method was used in a case study examining two charging stations on a grid. The objective of the case study was to distribute the load between those two stations in the most favourable way, so that the voltage level was raised at the location with the lowest voltage level. The voltage profiles for both stations are shown in Figures 3 and 4 – the station with the lowest voltage level being the one shown in Figure 3. The blue line represents the voltage when the price is the same at both stations, while the orange line shows the voltage when the price is dynamic.
Figure 3 makes it easy to see that the voltage level is improved by dynamic pricing. An important point to remember is that moving the load from one location to another should not equate with just displacing the problem. Figure 4 shows that the voltage level becomes a bit worse with dynamic pricing at the second location, but that this reduction is marginal when considering how much better the voltage level became at the first location.
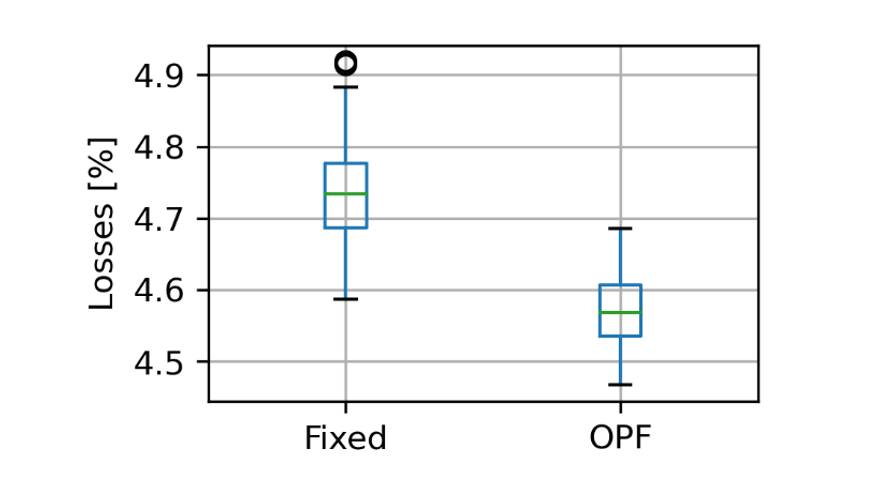
Another positive outcome of using dynamic pricing in this case is that the total losses in the grid are also reduced. In Figure 5, you can see a boxplot with the losses for each of the 100 days that were simulated. The green line in the middle of the box shows the median of all the simulations. The median value was reduced from 4.74% to 4.57%. This is a reduction of 3.58%, which is quite significant and shows that dynamic pricing brings a positive contribution to the grid in several ways.
An important premise for the study is that every driver is presumed to have the same likelihood of choosing the station that is closest, or the one that is cheapest. No consideration was given to how large the price difference must be to get a driver to switch charging locations. This is something what will be looked at in future work.
References
- Norsk Elbilforening, «Elbilsalg,» 2021. [Internet]. Available: https://elbil.no/om-elbil/elbilstatistikk/elbilsalg/
- Tesla, «Semi,» 2021. [Internet]. Available: https://www.tesla.com/semi
- Audi, «Audi e-tron,» 2021. [Internett]. Available: https://www.audi.no/no/web/no/bilmodeller/audi-tron/audi-e-tron.html
- K. K. Fjær, V. Lakshmanan, B. N. Torsæter og M. Korpås, «Heavy-duty electric vehicle charging profile generation method for grid impact analysis», 2021 International Conference on Smart Energy Systems and Technologies (SEST), Vaasa, 2021.
- K. K. Fjær, Analysis of Dynamic Pricing to utilise Spatial Flexibility in Heavy-Duty Electric Vehicle Charging Demand, NTNU, 2021.
0 comments on “Dynamic pricing of electric vehicle charging to better use grid capacity”