
Electrical vehicles (EV) are increasingly prevalent as a measure for decreasing emissions from transport. An electrified transport sector will demand a lot of our electricity grids. How can we prepare Norwegian grids for more electrical transport?
An increased electrification of the transport sector will bring new challenges to the electric power system operators to deliver the electricity needed for charging. Norway is effectively the EV capital of the world, with the highest number of EVs per capita, and has increased its EV sale exponentially every year in the past decade.
Domestic EV owners have a typical lifestyle pattern, and mostly charge their EVs at home. They charge their EV when they come home in the evening and expect it to be sufficiently charged in the morning when they leave for their professional activities. As a large part of the population charges their EVs simultaneously. A few questions arise:
- Do electricity distribution grids in Norway have sufficient capacity to fulfil future EV charging requirements, with necessary quality of supply?
- How many EVs can the current grid handle without smart charging?
- Can electricity market price driven EV charging unlock the puzzle?
Let us look at these questions one by one.
Do electricity distribution grids in Norway have sufficient capacity to fulfil future EV charging requirements, with necessary quality of supply?
With oversimplified calculations, one can arrive to both answers ‘Yes’ and ‘No’, based on the method adopted. A spatiotemporal (space-time) analysis of power flow in a distribution grid can give us valuable insight the reality. At the very least, power flow analysis for the peak load durations will reveal the bottlenecks that are present in the distribution grid.
To evaluate the situation, a study was conducted in a real Norwegian distribution grid. The distribution grid considered for the study consists of 856 customers, 974 buses and 1023 lines. In this grid, there are 32 transformers coupling medium and low voltage levels (22 kV/230 V), one local hydro generation station linked with 4/22 kV transformer, as well as a 22/66 kV transformer acting as upstream link, point of common coupling (PCC) and slack bus (reference bus) for the study. We had access to one year of customer Smart meter (AMS) data, with 15 minutes resolution. Thus, a base case is formed with 35 136 periods (366 days with 15 minutes resolution), 856 consumers, and 2 energy sources (the hydro plant and PCC as main feeders).
A virtual scenario emulating the presence of EVs is created. On average, Norwegian households have 1.3 cars. Therefore, 100 % EV presence is a situation with 1113 EVs (856 x 1.3) in the test grid. The charging demand for the EVs is created based on statistical data including daily drive distance, driving efficiency, arrival and departure times of car owners, as well as charger ratings at the residences of EV owners. The analysis comprises three tests. The first evaluates the distribution grid’s capacity for simultaneous dumb charging. The second aims to understand the impact of electricity market price-driven charging. The third test provides a solution to the future problem.
How many EVs can the current grid handle without smart charging?
The very first test is to investigate what capacity the distribution grid has for hosting EVs without altering their charging pattern, i.e., EV owners charging their vehicle as they please. The present base load in the grid without EVs causes a peak demand of 89 % of the grid capacity. Power flow analysis were performed by superimposing EV charging profiles, emulated for a dumb charging scenario, on the base load. The grid reaches its line limit with 18 % of EV population, but the voltage violation happens at a threshold of 54 % of EV population. Between 18 and 54 %, the grid operator can deliver on this demand without violating voltage quality of supply, which is the primary requirement for a distribution system operator (DSO). However, the grid losses will be high. Grid losses will cause both energy loss, which is not good for the environment, and financial loss as DSO absorbs the costs for the grid losses. It can also lead to shortening the lifespan of the equipment (lines and transformers). With 100 % EVs, the worst-case scenario will result in 150% overloading of grid capacity and the system voltage reaches 87.5 % of its nominal value.
Can electricity market price driven EV charging unlock the puzzle?
The second test is conducted to understand the impact of electricity spot market price-driven EV charging, as it is the case today, without considering grid limitations. The electricity price in hydropower-dominant Norway has less variations within a day in comparison to a country like Denmark, whose energy mix is much more centred around wind power. Therefore, there is no room to shift EV charging to benefit consumers with Norwegian market prices.
When more variablerenewable sources like wind and solar power increases, which is a near future scenario, price variations will increase. The consumption must be increased to match the generation, in order to avoid any renewable energy generation curtailment. A good example is the Danish electricity market price, where prices fluctuate widely, and sometimes even reach negative prices, based on wind power availability. Danish electricity market prices are a good test case to evaluate the impact on the physical system of electricity market price-driven EV charging. EV charging sessions are scheduled with the objective of minimising energy costs to EV owners, as well as minimising the cost due to losses for the system operator. The assumption is that the grid does not have any line and voltage constraints.
To test this case, we investigated a scenario based on a representative day in the Danish electricity market, with larger price variations. The test was repeated multiple times with different percentage of EV population. Then, the threshold of EV population that violates line and voltage limitations was identified with power flow analysis. When we apply grid limitations for power flow analysis, we see that market price driven EV charging can accommodate an EV population of 36 % before grid limitations are reached.
Though the price-driven charging moves the demand peaks of dumb charging to the valley, it creates a new peak in the valley, which causes grid congestion and voltage deviations. The results show us that the system operator can save the cost of losses by 8 % in comparison to the dumb charging, as the losses are higher when the consumption is high, and higher consumption occurs during low price hours.
Is there an alternative solution to the problem?
An honest evidence-based answer can be provided with a detailed MultiPeriod AC Optimal Power Flow (MPOPF) analysis. Power flow analysis can tell us the impact a given load situation has on a grid. However, it cannot provide the solution to the problem. The solution can be found by optimizing the power flow with source, demand, and grid constraints. Thus, we need an Optimal Power Flow solver capable of solving for multiple time periods by analysing power flow for every time period, as we want to deliver the total demanded energy. Single period AC OPF itself is a complex mathematical problem which demands high computational power and memory when the number of network nodes and controllable resources increase. The complexity of the problem multiplies with every incremental period for analysis, and the computational resources requirements grow exponentially, which is a real bottleneck for analysis.
A novel powerful MPOPF solver, BATTPOWER, was developed by the Electricity Markets and Energy System Planning research group at the Department of Electric Power Engineering at NTNU. Itbreaks the computational barriers all commercial MPOPF solvers have. This enables us to do an analysis for a grid with a large number of nodes and controllable resources for multiple periods.
The third test evaluates the BATTPOWER solver under extreme conditions by adding grid constraints and investigates the possibility of delivering the energy demand of 100 % EV presence (with the factor of 1.3 EVs per household) without violating the quality of supply criteria. The same representative days with larger price variations considered in the previous test were used for the analysis. The analysis tells us that it is possible to accommodate 100 % EV presence with the same cost in grid losses as in the previous test, without violating the criteria for quality of supply and without overloading any of the grid equipment. Figure 1 illustrates EV charging and its impact with and without MPOPF charge scheduling. The grid limitations for different cases are shown in Table 1.
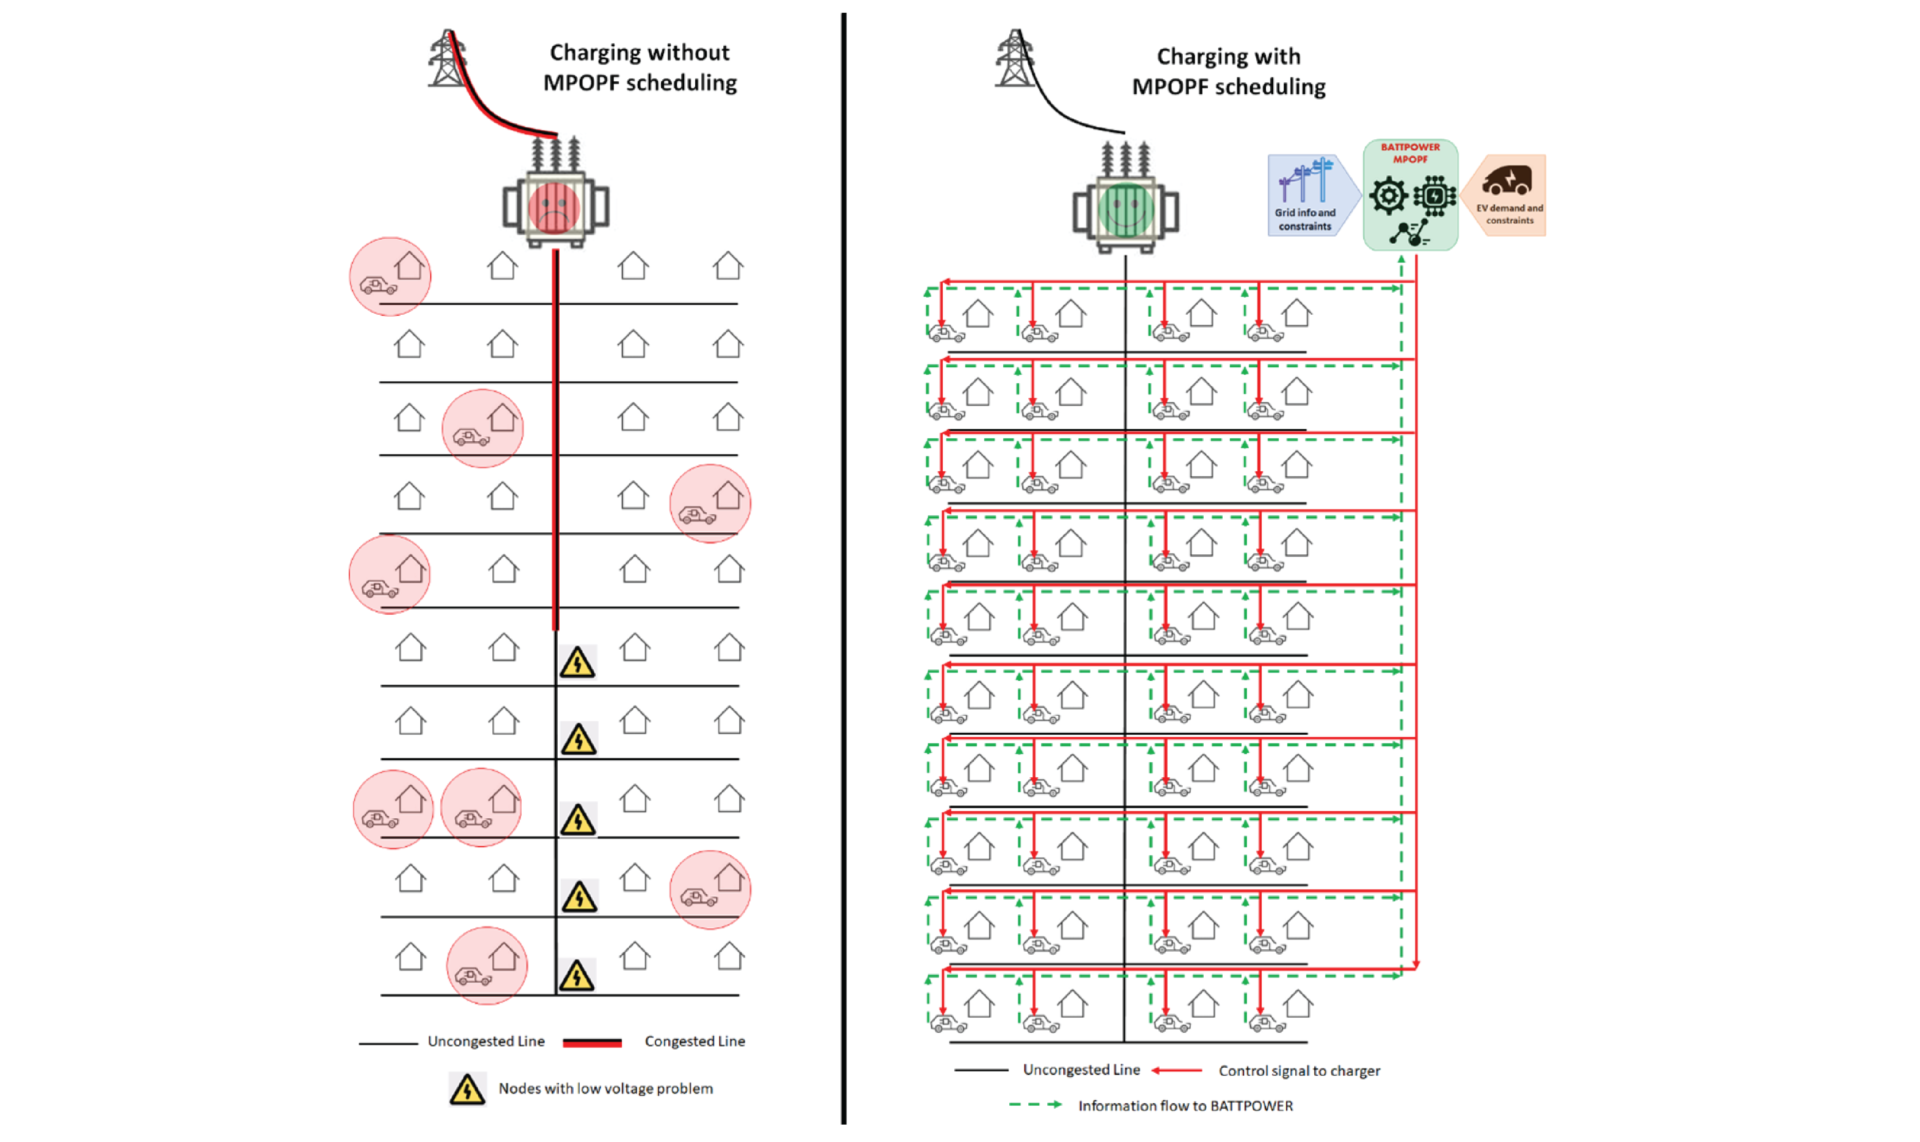
Figure 1. Illustration of EV charging and its impact with and without MPOPF charge scheduling.
Table 1. Summary of results from the 3 cases
 Conclusion
Demand scheduling using MPOPF will maximize the benefit to consumers, grid operators and non-dispatchable renewable energy producers. It is also beneficial to the environment, as the grid losses are reduced. It requires a large amount of information about the grid, predicted generation and demand, as well as an enormous number of computational resources with today’s MPOPF solvers, as shown in Figure 1.
The BATTPOWER MPOPF solver unlocks the problem of computational resource adequacy and makes MPOPF analysis possible for daily operational scheduling of resources in the distribution grid. Electricity market price-driven EV charging will postpone operational problems in the grid, but it cannot solve the problem inherent to the current market and price structure..
Norwegian distribution grids have adequate capacity to serve future EV charging demands, as long as EV charging sessions are scheduled properly. The new market entities like s, in cooperation with the flexibility market platform NODES, can predict, optimize, and schedule charging sessions, and provide services to make distribution grid operation more efficient.
(For further reading: “BATTPOWER application: Large-scale integration of EVs in an active distribution grid – A Norwegian case study”
0 comments on “Do today’s electricity distribution grids have adequate capacity for future EV charging demands? – A test on a real distribution grid in Norway.”