

Regulating the ventilation system on the carbon dioxide concentration alone may not get rid of the smell which originates from volatile organic compounds (VOC) in the air.
In the office, schools and kindergartens, carbon dioxide concentration in the air should not exceed 1000 ppm according to Arbeidstilsynet, the Norwegian Labour Inspection Authority. A Harvard study has shown that air quality affects scoring on cognitive tests, and best scores were clearly achieved when exposed to low CO2 and VOC levels. VOC levels are not regulated by concentration, as the correlation between individual VOC’s and air quality is still not clearly understood.
Using VOC sensors in combination with carbon dioxide regulation is the best way to ensure good indoor air quality without wasting energy on a total air replacement solution.
For several years, SINTEF Industry has worked with monitoring emissions from industry. Now we have turned our attention to VOC online process monitoring as part of the PAHSSION project. As limited commercial instrumentation is available, we have developed a VOC sensor system, SINTSENSE, which will be available for testing in industry in June 2020.
Sensor technology for online VOC assessment
Carbon dioxide is normally monitored by non-dispersive infrared spectroscopy (NDIR) sensors. The cost is low (less than € 100), and the performance of the sensor is generally good with little drift. Self-calibration can be done periodically by exposure of the sensor to outdoor air.
The development of metal oxide sensors (MOS) has progressed fast in recent years. By heating a metal oxide substrate (e.g. tin oxide), reactivity with surrounding gases is achieved; reaction with adsorbed oxygen alters the resistivity of the metal oxide and can be utilized analytically. The metal oxide can be doped for specific gas reactivity (e.g. palladium for hydrogen reactivity).
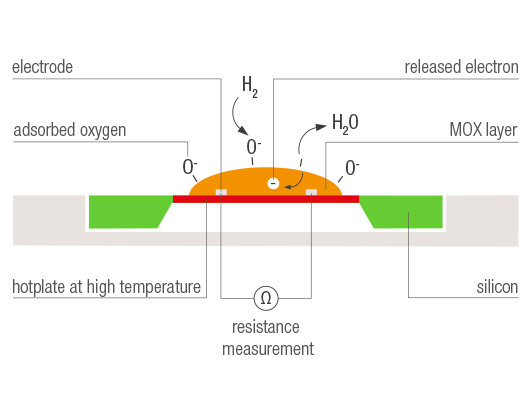
Due to contamination of the metal oxide surface, these sensors are prone to drift and loss of sensitivity. Several strategies are available for surface regeneration. Self-calibration can be performed by exposure to ambient air, that contains 1 ppm hydrogen. Sensors are frequently used to monitor VOC in air. To regulate ventilation, a semi-quantitative measure of VOC as CO2-equivalent measure can be used. The main advantage of these sensors is that they are very cheap (< 30 €) and can be replaced frequently. The need oxygen in air to operate and compensation for air water content must be made.
Photo-ionization detection (PID) is another alternative for analysis of VOC. By application of an ultraviolet (UV) lightsource, gas can be ionized. By controlling a voltage field in the ionization chamber, a current resulting from charged gas species can be utilized for analytical purposes. Typical light sources include xenon (8.4 eV), krypton (10.0 and 10.6 eV) and argon (11.7 eV). Whereas the PID response is not selective, the selection of lightsource can discriminate gases from being ionized.
For instance, polyaromatic hydrocabons (PAH) can be measured with an 8.4 eV lamp. A lamp of 10.0 eV would additionally include BTEX (benzene, toluene, ethylbenzene and xylene) components. Sensors are very sensitive, and detection of VOC down to low ppb level is possible. The cost of a PID electrode is in the range of €500.
Online monitoring of VOC and PAH
For several years, SINTEF Industry has worked with monitoring emissions from industry. PAH emissions are monitored by discrete sampling for emission points, typically for a few hours. PAH emission levels have shown large variance between results. It has been speculated that the process variations affect PAH emissions, but there is currently not a clear understanding of this correlation. More frequent or longer sampling periods are beneficial, but sampling and analysis of PAH are too expensive for this to be a viable solution.
There is a global trend of moving towards online monitoring of emissions. Continuous Monitoring systems (CEMS) are in constant development and new technology opens for online monitoring with the required sensitivity. An example here is quantum cascade laser technology for montoring of PFC and NOx. For PAH’s online monitoring is limited by the fact some of the heavier compounds have low vapor pressures below 100 °C. The lightest PAH, have a boiling point of 218 °C.
Legislative BAT and BREF documents describe predictive monitoring system (PEMS): if a correlation with the emission to be monitored can be established, monitoring can be performed by indirect measurement of a measurable quantity that correlates with the emission.
In the PAHSSION project, funded by the Research Council of Norway, one of the goals is to use a by-proxy approach to monitoring of PAH. By understanding how the PAH emission distributes among individual components, a correlation with lighter and measurable components can be made. Naphthalene is one alternative, but other organic, inorganic and physical parameters could be used as well with a multivariate approach to establishing the correlation.
SINTSENSE
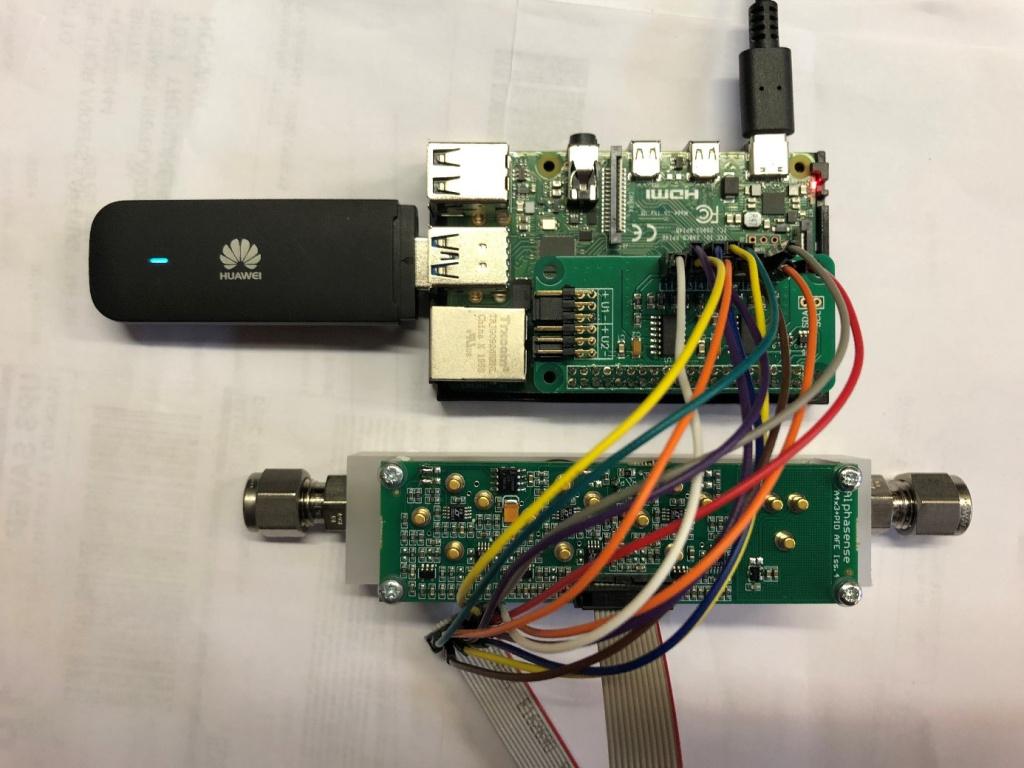
Limited commercial instrumentation is available for online process monitoring of VOC/BTEX/PAH. Insprired by a project for environmental monitoring of fracking, we decided to device our own VOC sensor system to deploy in industry as part of the PAHSSION project. The system is comprised of a Raspberry Pi v4 computer running Raspbian OS. A plug-n-play 4G modem is used for networking and the system is remotely accessed with TeamViewer. An eight channel AD converter is installed on the RPi for input from the gas sensors.
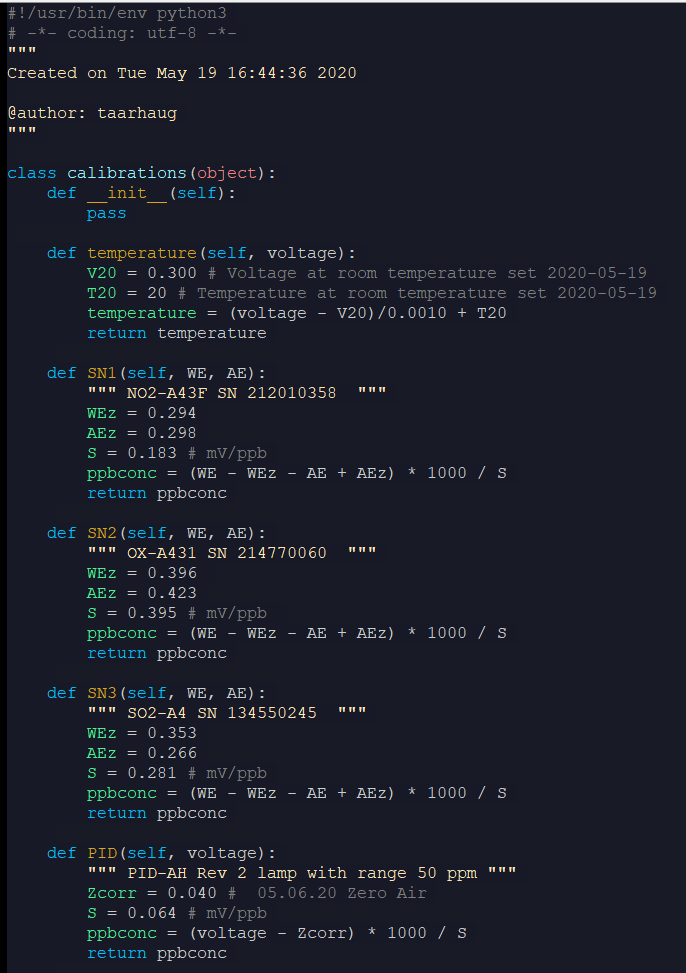
Four gas sensors from Alphasense is installed on an analogue front end (AFE): PID, NO2, OX (O3 and NO2) and SO2 along with a Pt1000 temperature transducer. These five sensors on the AFE are connected to the eight AD channels on the RPi.
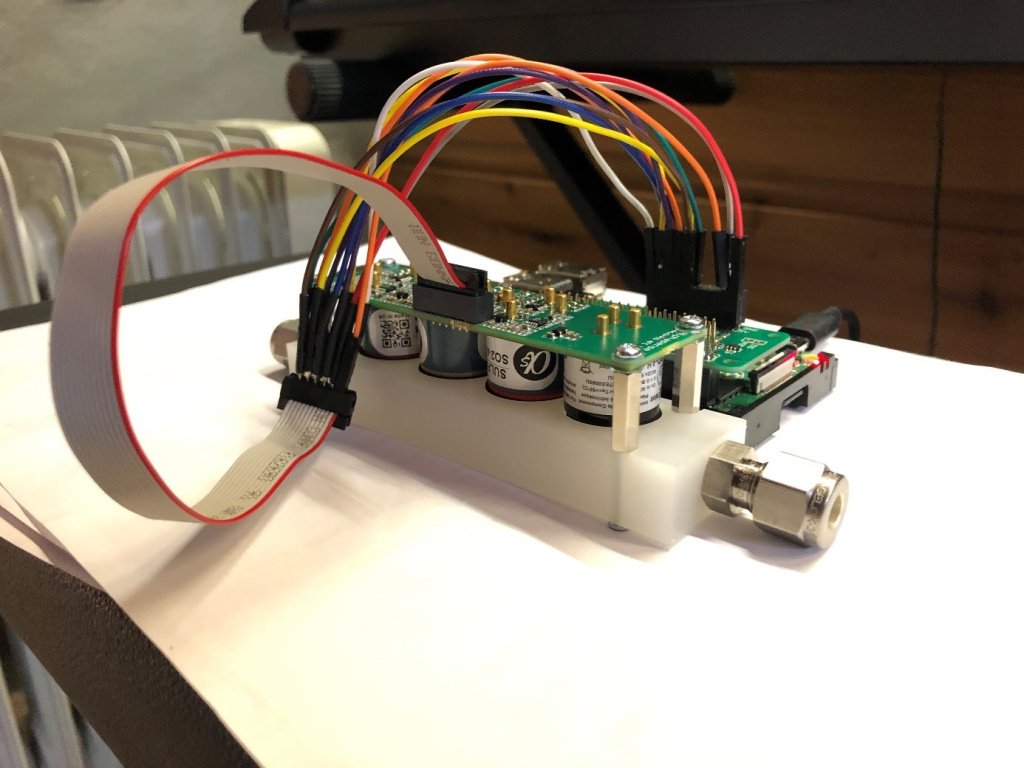
As shown in figure 2, the sensor heads are inserted in a teflon gas channel allowing for passing of gas through the two SwageLok ¼” connectors. Sensors are replaceable: A PID electrode with higher working range than 1 ppb – 50 ppm can be installed, and the SO2 sensor can be replaced with a CO or H2S sensor.
Python API for the AD was available from the manufacturer, and data is transferred to an influx database. Grafana is used to display results online in a browser on the RPi. Extraction of data from influx db to CSV file allows for transfer of data for further analysis.
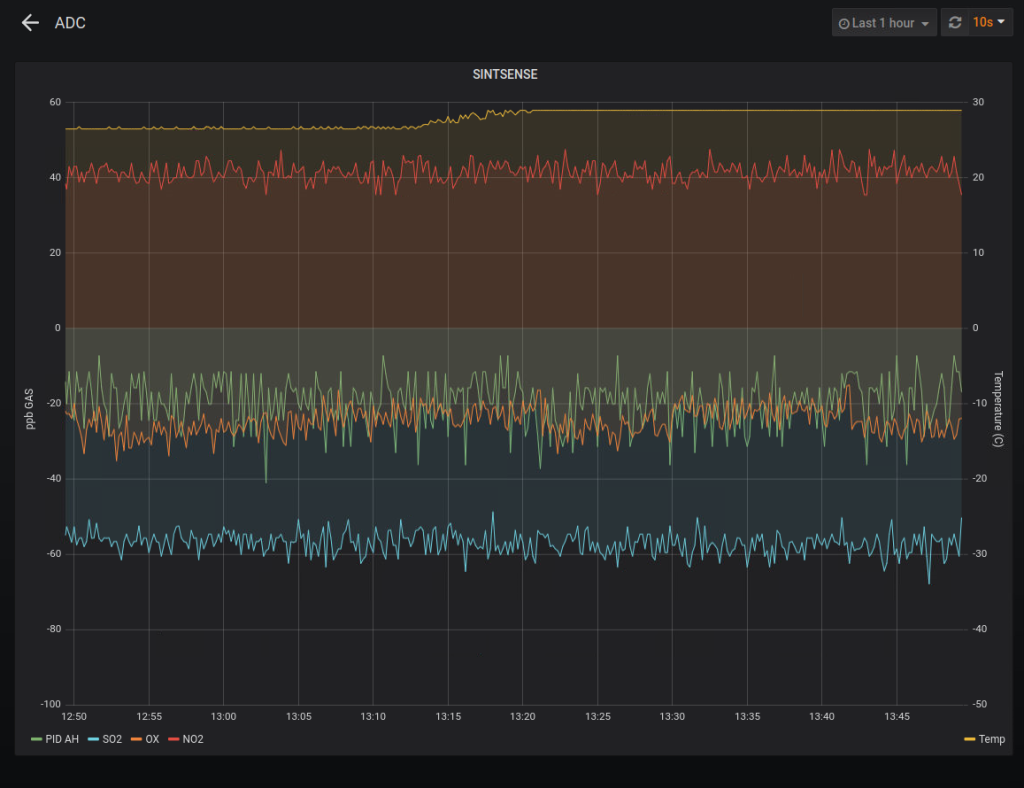
The AFE output is 0-5 V signals. Translating the response to concentrations is performed by a python class. Zero gas (i.e synthetic air) is used to correct the response of the sensors before they are dumped in the influx database.
Deployment in industry
The plan is now to deploy the SINTSENSE in industry. Continuous logging of VOC will hopefully give useful information about the periodicity of emissions and help to understand how the emissions are correlated with the process.
The cost of the SINTSENSE system is around NOK 10,000, making it very attractive as an alternative for online monitoring of VOC emissions. Reproducing the system should require very little time per unit for assembly and configuration of software.


Comments
Hei,
System is available. For specification of the PID sensor used, please see: http://tinyurl.com/3mb8vtd7
System is not EPA approved. For PAH, there are of course a lot of components with only slightly different ionization potentials. For total PAH or emissions dominated by a few PAH, e.g. naphthalene the PID can be a good approximation to the total PAH. There are of course other intereferences from other hydrocarbons but also NOx.
Thor
Is this sensor system for PAH with Raspberry PI 4(5) available?
Is this system approved by the EPA or any other confirmation for the sensor’s accuracy?
Goedemorgen,
Wij zijn een wegenbouwbedrijf met 8 asfaltcentrales waar PAK’s een actieve uitdaging is, graag zou ik er met u eens over willen spreken.
Met vriendelijke groet,
Marcel Warmerdam
Marcel, my Dutch is not the best. Could you send me an email in English with your question.
Thanks. Thor