Bloggers: Svend Tollak Munkejord, Morten Hammer and Sigurd W. Løvseth
Many things are known about CO2 transport, e.g., that it is feasible and safe.
However, if full-scale CO2 capture and storage (CCS) were to be deployed today, conservative design and operational decisions would have to be made due to the lack of quantitative validated models.
Reviewing 386 articles to improve current models
This is one of the main conclusions of a review article we wrote, and which is to be published in Applied Energy. (The interested reader not having access to the journal may read our preprint.) Based on 386 references, the article gives the status for data and models relevant for CO2 transport, including models handling the properties and transient single- and multiphase flow of CO2-rich mixtures.
Current models need improvement with respect to both fluid flow and thermophysical properties.
Current models need improvement with respect to both fluid flow and thermophysical properties. This is highly relevant also for the whole CCS chain. The future CCS system not only needs to be safe, but also efficient with respect to energy and cost. Then engineers will need modelling tools to be able to design and operate the system in an optimal way.

What safe and cost efficient CO2 transport needs
The knowledge gaps should be addressed in parallel with practical CCS deployment. Here are some of the subjects we found where research is needed.
- The development of accurate (and practical) property models for CO2-rich mixtures valid in the pressure, temperature and composition ranges relevant for CCS. To do this, experimental data are needed. Today, for many of the relevant impurities, the available data are scarce, inaccurate, or both.
- Fiscal metering will be needed in order to facilitate government control and transactions in a future CCS market and the lack of accurate property models could have large cost impacts.
- Data and models for the depressurization of pipes and vessels are needed for safe and efficient design and operation. Since these processes are often fast, the different phases (gas, liquid, solid) are not always in equilibrium.
- Models able to predict running-ductile fracture in CO2-transport pipelines are needed to ensure safety while avoiding costly full-scale experiments in each case.
- Regarding ship-transport of CO2, one of the main challenges appears to be the optimal chain design. It has to include the liquefaction, conditioning and possible processing at the injection site. Issues like well integrity and the response of the CO2 reservoir should also be considered. This will require good knowledge of the relevant CO2-rich properties, as well as flow in the well, the interaction of brine and CO2, etc.
Must account for the formation of solid CO2
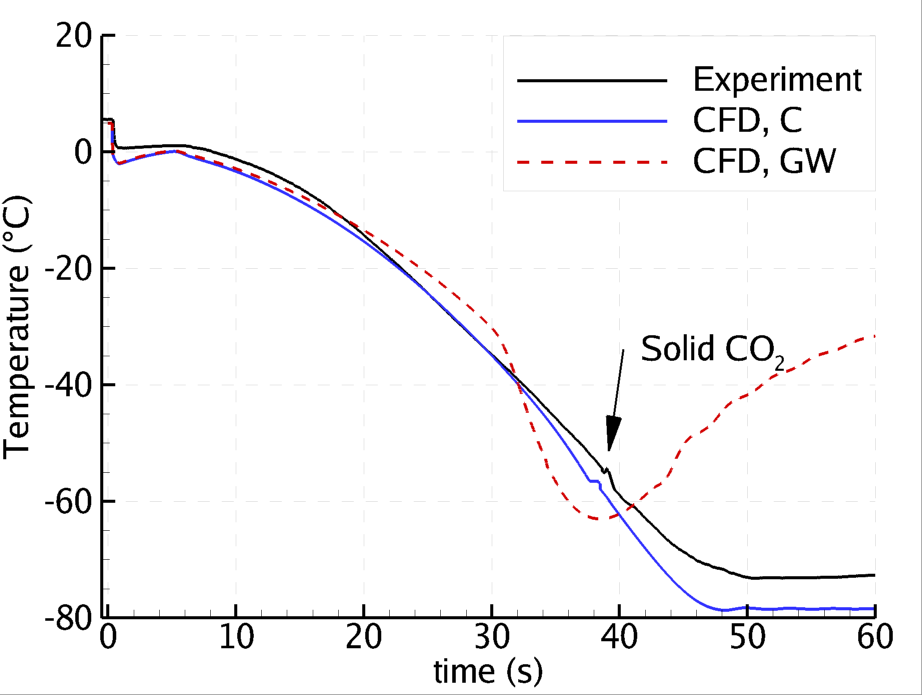
In the article, we could not resist performing some calculations ourselves. We studied one of the pipe-depressurization experiments performed by DNV GL. In these experiments, a straight pipe was filled with CO2. At a certain time, one end was opened to the atmosphere, and pressure and temperature were recorded at various positions inside the pipe. This can be seen in Figures 1 and 2, where we have plotted experimental data along with calculations from our 1D two- and three-phase CFD model. The black line represents the experimental data. The blue line and the red dashed line represent our CFD calculations, with the only difference being the in-tube heat-transfer correlation. (‘C’ denotes Colburn and ‘GW’ denotes Gungor–Winterton). Close to the outlet (Figure 1) one can see that the use of the Gungor–Winterton correlation gives the best result. In particular, the minimum point is quite well captured. This is the point where there is no solid or liquid CO2 left, and the flow is gas-only.
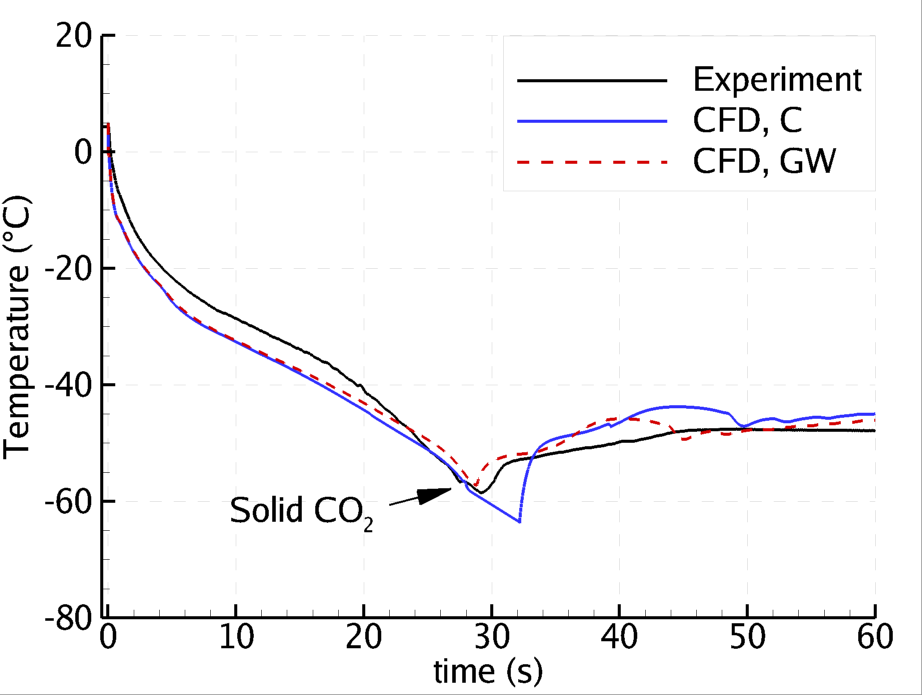
Near the closed end, the conclusion is the opposite. Here, the Colburn heat-transfer correlation gives far better results. The reason for the large difference is the occurrence of solid CO2 (dry ice). This can be seen as a kink in the experimental data (and in our calculation) at time about 40 s. The Gungor–Winterton correlation gives too high heat transfer, such that the CO2 does not enter into the area where solid CO2 is formed. As can be seen, the solid CO2 contributes to keeping the temperature low.
- Find out more about SINTEFs’ expertise on CO2 transport.
This calculation shows that CO2 flow and depressurization models must be able to account for the formation of solid CO2. Second, it is important to model the heat transfer through the pipe wall to the surroundings.
This work was performed in the BIGCCS International CCS Research Centre.
Do you want to know more about our research on CO2 transport – read these blogs:
- Gas or liquid: new CO2 mixture property knowledge needed for efficient and robust CCS
- Simulating running ductile fracture in CO2 pipelines
- Flow of CO2 in pipes
- Why models are important for safe and efficient CO2 transport
0 comments on “CO2 transport requires quantification”