As pointed out in numerous studies, large-scale deployment of CO2 capture, transport and storage (CCS) is required in order to effectively mitigate the man-made global warming. However, a wide-spread development of CCS systems will only materialize if their cost and robustness are optimized and safety ensured, which will depend on accurate property models for the fluids involved. Accurate measurements of relevant properties are currently a prerequisite for dependable and precise models. Hence, two of the main objectives of Task 8 in Norwegian Research Centre (NCCS) is to fill gaps in accurate thermodynamic and transport property data by performing new measurements.
New data on and models of CO2 with impurities
Currently, there are thermodynamic property models (equations of state, EOS) for purefication of CO2 that have fairly high accuracy. In practice, though, there will be impurities present in the CO2 source, as well as in the storage reservoirs. Purification is costly, and accurate tools to calculate the impact of typical impurities are hence needed. Such models are most efficiently built from data on binary mixtures between CO2 and individual impurity components.
Hence, in an article from NCCS that has recently been published in the Fluid Phase Equilibria reference journal, new measurements of phase equilibria of the CO2-CO binary system are provided from the purpose built CO2Mix facility. In 2018, articles have also been published with new phase equilibrium data on the CO2-Ar and CO2-CH4 binary systems using the same setup. These three impurities are important for CCS. Captured CO2 may have concentration of CH4 and argon of multiple percent depending on the CO2 source and capture process, while it is well-known that CO can be produced from oxygen-lean processes. CO is a highly poisonous gas, whereas CH4 is combustible. Hence, proper safety measures had to be taken.
The phase equilibria of four temperatures of the CO2-CO system, 7 temperatures of the CO2-Ar system, and 3 isotherms of the CO2-CH4 system have been mapped in these publications, mostly in areas without data or data in need of verification. Hence, a significant improvement of models for CO2 with these impurities are enabled. In all three articles, EOSes are fitted to the new data, and a new Helmholtz reference model was presented for CO2-Ar.
Examples of new phase equilibrium data and significant model improvements
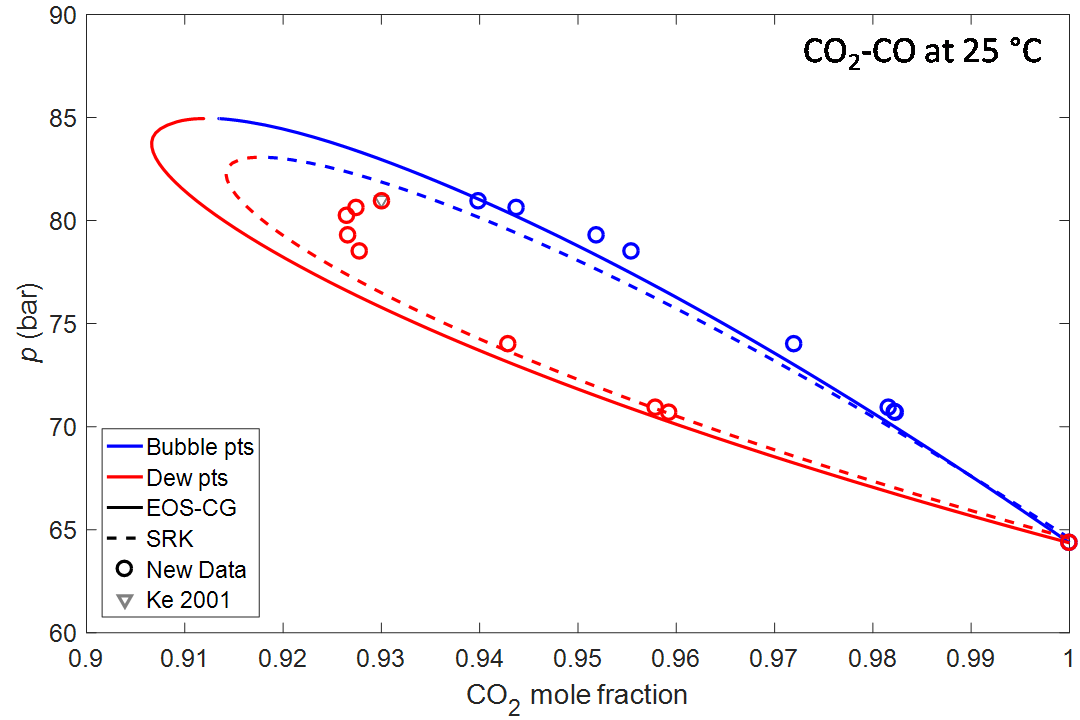
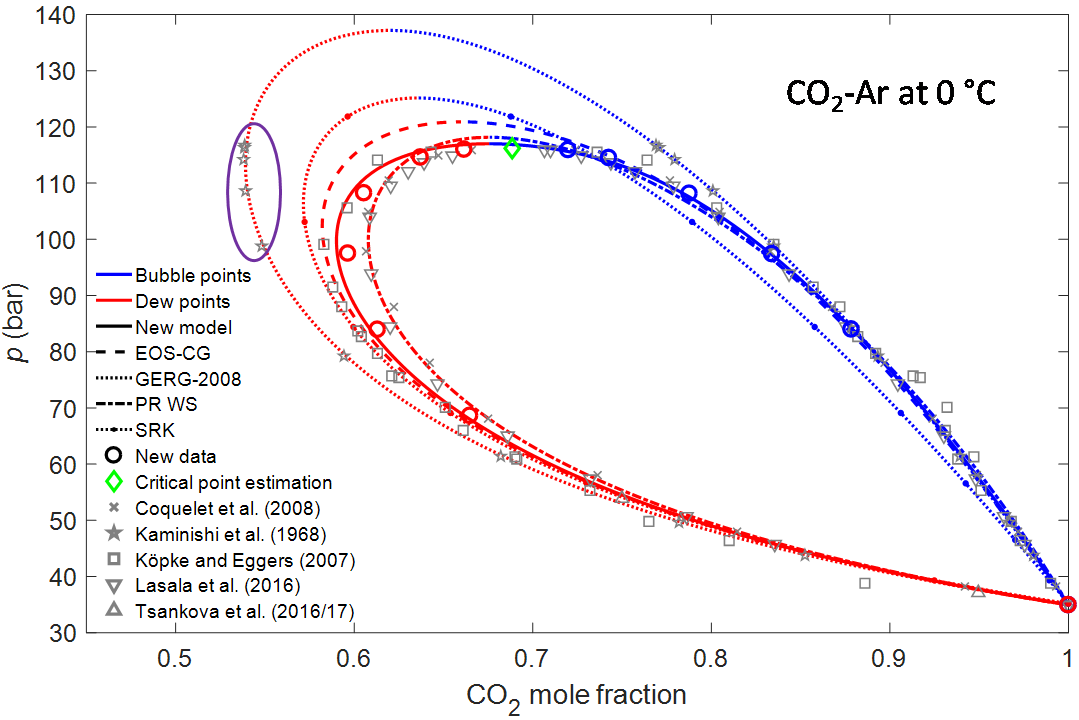
Some examples of the new data are provided below. Each figure presents the phase equilibrium data at a given temperature with other data from the literature and with prediction from existing models. For a pure substance as water at a given temperature, liquid and vapor can at equilibrium in a closed container only coexist at a single pressure, the boiling point. This is different for a mixture, where vapor and liquid typically can coexist over a range of pressures between the dew point (red in the figures below) at low pressure and boiling point (blue) at high pressure. The dew and boiling point pressure is shown as a function of composition, and the area enclosed between the dew point and boiling point curves are called phase envelopes.
CO2-CO
For CO2-CO at 25 °C, only a single experimental point prior to our work was found. As expected, the existing models hence did not make a very good fit to the new data.
CO2-Ar
For CO2-Ar at 0 °C more literature data were found, but the prior data were scattered and in need of verification. The new data provided by the CO2Mix facility enabled a significant improvement of the existing model. GERG-2008 is a very popular EOS for natural gas which is implemented in many process simulation tools. At the time when this EOS was developed, only a single phase equilibrium set was available at this temperature (Kaminishi 1968). As seen in the figure, the GERG team fitted those measurements perfectly, but the problem is that the data set available had a large deviation from later measurements. Consequently, at 25 °C the GERG phase envelope is two times bigger than the data support. Such large inaccuracies may lead to expensive overdesign or, worse, negative surprises and this example illustrates that property data always should be verified by independent measurements.
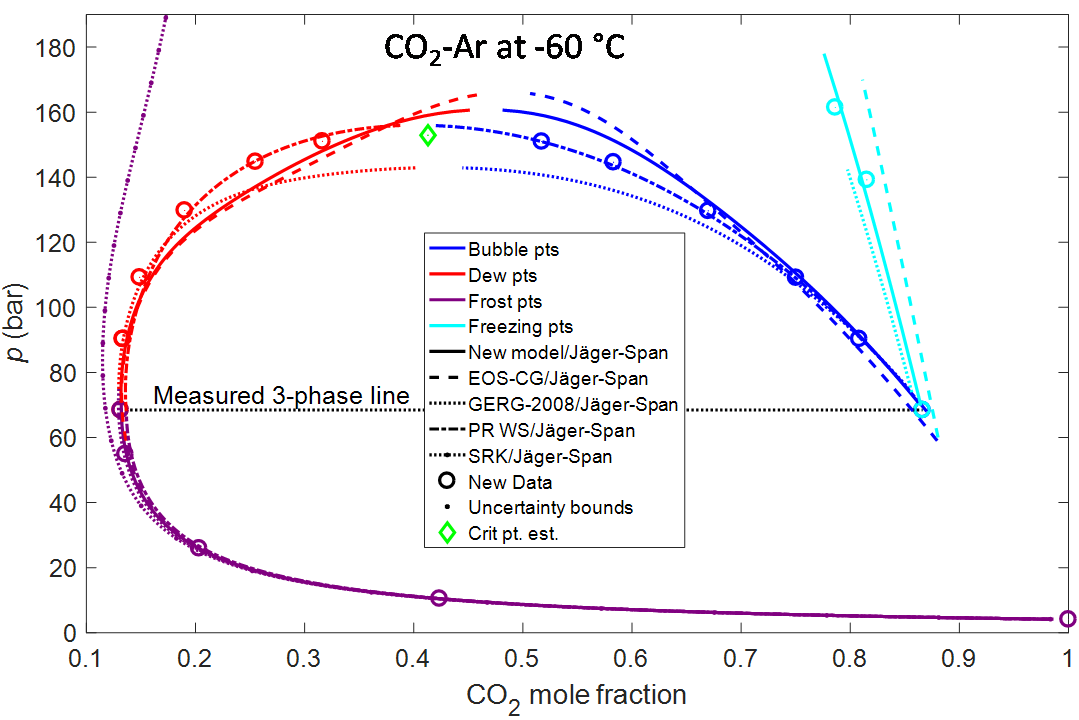
Impurities also affect the formation of solids of a fluid, as illustrated in the final figure for CO2-Ar at 60 °C. For pure CO2, this temperature is below the triple point temperature at−56.6 °C where dry ice, liquid, and CO2 may coexist. Addition of some argon enables the presence of liquids below the triple point temperature of pure CO2. Determining the temperature where dry is formed is very important for a number of processes, for instance for low-temperature separation processes where the CO2 will coexist with impurities. Very little data exist for dry ice formation. Phase diagrams involving solids could be quite complex, but both equilibrium between vapor and solids (frost points), liquid and solids (freezing points), vapor and liquid (dew and bubble points), and vapor, liquid and solids (three phase line) were measured. Due to the lack of data, it is no surprise that prior models did not predict the data very well. In fact, a common EOS, the SRK cubic equation of state, with typical parameters, did not predict the co-presence of two fluid phases at all!







Comments
No comments yet. Be the first to comment!