For post combustion CO2 capture, solvents which are blends of amines and/or other additives are often used. Monitoring of the solvent composition is needed for optimal performance. Today, monitoring is often done manually. Using multivariate calibration models (PLS-R) based on FTIR spectra could be a possible way to digitalize solvent monitoring. In Norwegian CCS Research Centre (NCCS) we have researched how this can be used in CO2 capture plants.
Learn more about CCS
Join our newsletter to stay updated with all the latest research results and news from NCCS: The Norwegian CCS Research Centre.
Manual analysis vs online techniques based on PLS-R and FTIR
Typically, the solvent concentrations (amines, water, CO2, etc.) is determined off-line by manual sampling and laboratory analysis. The use of off-line analytics does not give immediate feedback to the actual state of the process and such analysis may also be expensive. CO2, amine and water content are dynamic parameters directly related to the process performance. In real processes solvent degradation and accumulation of contaminants may cause severe operational problems. Thus, methodology which could alert when build up or changes occur in the solvent may give valuable improvement in operating the processes.
Online techniques based on Partial least square regression (PLS-R) and vibrational spectroscopy such as FTIR should be a possible alternative for monitoring the major solvent compounds in CO2 capture plants using amine solvents. The application of online monitoring will reduce cost of chemical analysis and could be important input to control strategies for energy saving in the process. Important criteria for online techniques are that they should provide the major components of the solvents (amines, CO2, water), be robust, easy to use and have low costs.
Calibration model tested on realistic degraded MEA samples
published in International Journal of Greenhouse Gas Control, I and my colleagues (Merete Wiig, Aslak Einbu and Solrun Johanne Vevelstad) tested PLS-R methodology on FTIR spectra and densities for a large set of MEA solvent samples. The work is focused on the PLS-R models and includes sets of realistic degraded solvent samples ranging from bench scale experiments to pilot plant campaigns.
The developed methods showed good agreement against reference concentrations, though with exception of samples with high amount of heat stabile salts (HSS). For the real samples, sample residuals (i.e. part of data not fitted by the model) were also studied, and a clear correlation between the residuals and degradation were observed. The work demonstrates that use of FTIR should be a good alternative for monitoring of solvent composition in MEA solvents.
Would the prediction of solvent compounds be affected by degradation products?
For monitoring of solvent composition, it is important to use robust methods. As amine solvent like MEA usually will have some degradation during operation. Other so-called degraded products will be formed. Here at SINTEF we have studied the effect of the presence of several major degradation products (like HEPO, HeGly, MEA-UREA, formate, sulphate) in MEA solvent on model prediction and robustness. One option would be to include these products in the calibration.
However, we found that a calibration and quantification of the degradation products with the FTIR and PLS-R was not feasible for the typical concentration range of these products (<0.5wt%). We found that the effect on the prediction of the solvent compounds (MEA, CO2 and H2O) was small for these concentration ranges of the degradation products. Exceptions were typically heat stabile salt compounds. When concentration of these salts exceeded around 0.5wt%, a significant effect on the spectra was observed as well as on model prediction. This should normally not be a large problem as CO2 capture plant will start with virgin solvent with only traces of such compounds and the solvent will be reclaimed or changed before high levels occurs.
Could sample residuals contain additional information?
When predicting results with the PLS-R model, residual can also be calculated (i.e. the part of the data that are not modelled, often denoted as X residuals). The residual is the difference between the recorded spectra and the modelled spectra. From this a so-called sample residual, which is a single positive number (mean square error of the spectra), can also be calculated. This imply that the sample residuals will increase with increasing changes of the solvent with respect to the calibration set made of virgin solvent. Thus, one may expect that increasing degradation or contaminants will increase the residuals.
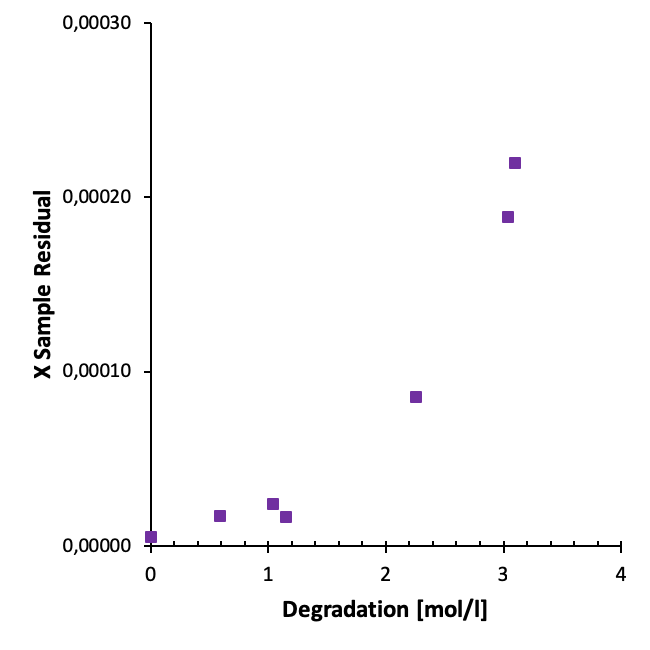
In our work we have studied the residuals from different sets of aged samples. For instance, we observe a clear correlation between degradation and the residuals for samples from oxidative degradation experiments (heavily degraded samples) as illustrated below.

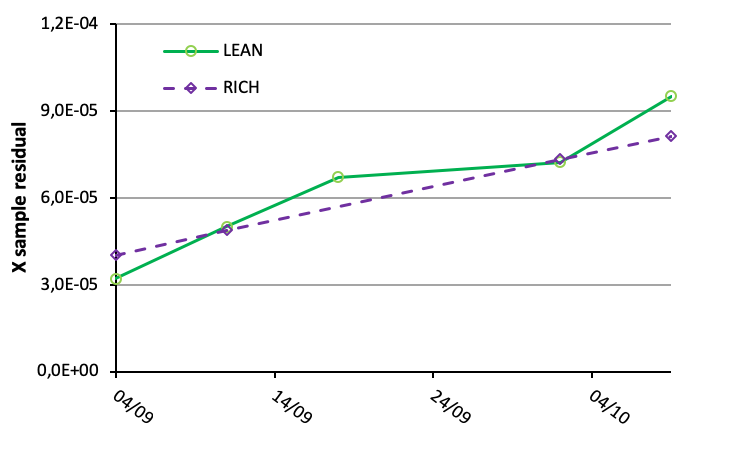
For samples from the we also observe an increase in sample residuals with increasing time as illustrated in the figure below.
Direct monitoring of specific degradation products and contaminates is important. However the sensitivity of online techniques is not as good as for dedicated offline analysis, and concentrations may be in the g/l range before degradation products can be quantified. So maybe it is sufficient to get an alert when significant changes in the solvent appear. In this matter, sample residuals could be used. Then, when a set limit is reached, dedicated offline analysis could be applied.

More details can be found in our recent paper.
FTIR
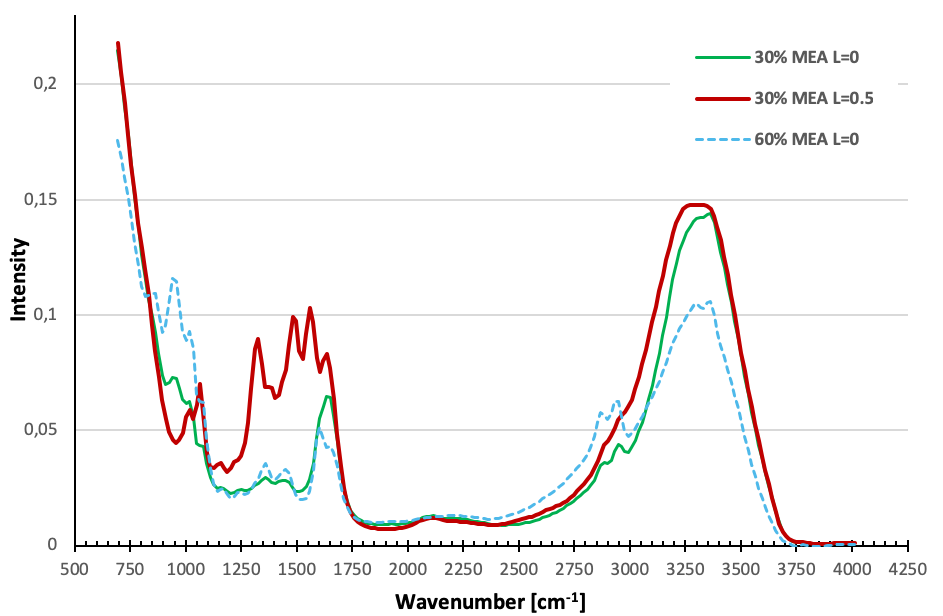
Infrared spectroscopy exploits the fact that molecules absorb frequencies that are characteristic of their structure. These absorptions occur at resonant frequencies, i.e. the frequency of the absorbed radiation matches the vibrational frequency. IR spectroscopy is often used to identify structures because functional groups give rise to characteristic bands both in terms of intensity and position (frequency).
Fourier-transform infrared spectroscopy (FTIR) is a technique used to obtain an infrared spectrum of absorption or emission of a solid, liquid or gas. An FTIR spectrometer simultaneously collects high-spectral-resolution data over a wide spectral range. The term Fourier-transform infrared spectroscopy originates from the fact that a Fourier transform (a mathematical process) is required to convert the raw data into the actual spectrum.

PLS-R
Vibrational spectroscopy like FTIR is well suited to be used with multivariate calibration, as each observation is characterized by analytical signal/absorbance recorded at multiple wavelengths (Tomuta et al., 2018). Among multivariate data analysis, Partial Least Squares regression (PLS-R) is often used for treatment of such data (Rathore et al., 2011). PLS-R is closely related to principal component analysis (PCA).
Learn more about CCS
Join our newsletter to stay updated with all the latest research results and news from NCCS: The Norwegian CCS Research Centre.
In PCA, the original variables (X) is reduced to a few new variables (principal components) in directions that explain the main variation in the data set. Mathematically this is done by determined the eigenvalues and eigenvectors of the covariance matrix (XT•X) where the vectors with highest eigenvalues are chosen. These new variables (PC’s) could then also be used in a linear regression against a response variable (Y) where this called principal component regression (PCR). The methodology in PLS-R is quite similar but here also the structure of the response variables (Y) effects the determination of the principal components. PLS-R is a generalization of multiple linear regression (MLR) and can analyse data with strongly correlated, noisy and numerous X-variables and simultaneously model several response variables (Wold et al., 2001).


Comments
No comments yet. Be the first to comment!