Floating offshore wind is at an early stage of development without any established supply chain or cost level. The few demonstration projects that have been built do not provide a firm basis for estimating the cost of future floating wind farms. The purpose of this article is not to give a definite answer about what the future cost of floating wind energy will be, but rather to invite a knowledge-based debate on how to cut the costs.
The basics of calculating the cost of wind energy
The Levelized Cost of Energy (LCOE) helps compare the costs of different technologies and measure the benefits of technological improvements. It represents the average unit cost of energy over the lifetime of a wind farm, adjusted for present value.
The LCOE includes all costs throughout the wind farm’s entire life cycle. It accounts for the development, capital, and operational expenditures (DEPEX, CAPEX and OPEX), as well as decommissioning costs, while factoring in the lifetime, discount rate and annual energy output. Together, DEPEX and CAPEX constitute the initial investment costs.
Traditional methods for estimating future costs often rely on past trends and disregard potential savings that can be achieved through deployment, research and innovation.
Suggesting a more fundamental approach to estimate costs
We suggest a different approach that applies a fundamental model in which cost is derived from design specifications, the amounts and costs of raw materials, and the costs of manufacturing and installation, assuming a well-established supply chain.
The approach presented here is useful for comparing the costs of different technologies and to quantify how certain technology improvements or other factors can influence the cost. It is not meant for companies as specific investment analysis or as a basis for bidding decisions in auctions.
There are ample opportunities for cost reduction outlined in the scientific literature, for example by ORE Catapult and from research done by NorthWind and other projects. The European industry and research group ETIPWind highlights that the future LCOE of floating wind is a function of deployment, research and innovation. They estimate that at a total installed capacity of floating wind of 20 GW, the LCOE may be reduced to somewhere between 40 and 80 EUR/MWh. In short: research and innovation drives costs down, while policies determine the speed of the development.
According to recent news articles, Chinese suppliers are offering turbines at a cost of 300 000 USD/MW, corresponding to 3.3 MNOK/MW. This is dramatically cheaper than the example of land-based wind at 14 MNOK/MW and demonstrates the rapid development of cost reductions for wind turbines as the market is maturing and volumes are increasing. Further cost reductions may be achievable, through radical new technologies like WindCatching’s multirotor concept or WorldWideWind’s tilted vertical-axis contra-rotating turbine. However, as a conservative estimate, we used 3.3 MNOK/MW as basis for the cost of a future floating wind farm, and added 25% for marinisation, obtaining a total of 4.1 MNOK/MW. In addition to the turbine cost, there will be development costs that should be about the same as for land-based wind, while the floaters, mooring and grid connection constitute the lion’s share of the investment costs. These are components that are known from offshore oil and gas as one-off special design, while for large-scale floating wind, they should be produced in an efficient series-manufacturing process.
The cost of raw materials varies heavily depending on market conditions, and no attempt is made here to make an accurate estimate of the future price of steel or ballast. Instead, the current price is applied. For steel plates, this was around 10 NOK/kg at the time of writing (October 2024), while for ballast, 0.5 NOK/kg seems a reasonable estimate.
Fundamental cost estimation for floating wind farm

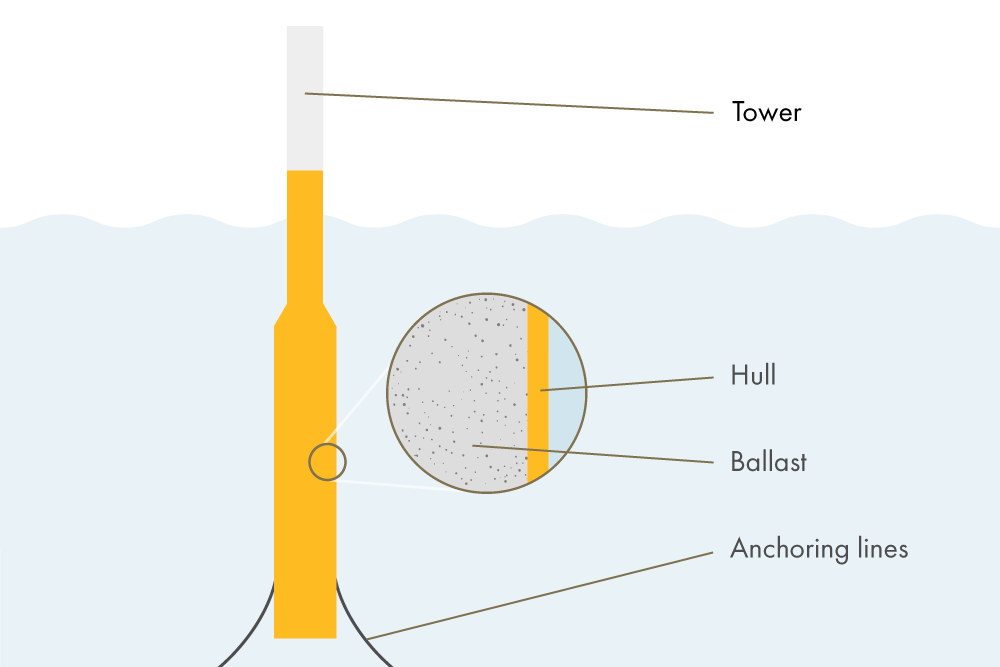
The concept of making a fundamental cost analysis is illustrated with the example of a spar floater as shown in the figure above. The example is not a complete cost analysis but can rather serve as inspiration for more detailed and thorough analysis.
A spar floater has a construction that is comparable with a wind turbine tower. A wind turbine tower can be manufactured in large series for a relatively small cost compared to the cost of the raw material. For example, if the cost of the steel plates delivered to the factory is 10 NOK/kg, the cost of the tower may be 11 NOK/kg, i.e. a manufacturing cost-factor, Cmc = 1.1. At a fully developed process for manufacturing spar floaters, the hull could be produced at the same Cmc = 1.1. Indeed, the hull could also be made of concrete, and possibly cheaper than steel. This option is omitted here.
The cost of the ballast and of the mooring system come in addition. Of these, the mooring system is the most complex and expensive. It may be constructed using a combination of steel chain, fibre ropes and heavy anchors, though for simplicity, in this preliminary analysis, it is assumed that the mooring system is all made of steel with a manufacturing cost-factor Cmc = 2.0.
In Souza and Bachynski-Polic (2022), a design of a 20 MW floating wind turbine is depicted. Applying the design, and assumptions on cost of raw materials and manufacturing, the investment costs of the floater and mooring system appear as summarised here:
- Floater hull: 3430 tons of steel at 10 NOK/kg and a factor 1.1 for manufacturing give a cost of 37.7 MNOK, corresponding to 1.9 MNOK/MW
- Floater ballast: 28600 tons, partly solid and partly water, assumed at a cost of 0.5 NOK/kg, gives a cost of 14.3 MNOK, corresponding to 0.7 MNOK/MW
- Mooring system: 601 tons of steel, assumed at a steel cost of 10 NOK/kg and a factor 2.0 for manufacturing gives a cost of 12 MNOK, corresponding to 0.6 MNOK/MW
Investment costs of future floating wind farm
The table below summarises the investment costs for a future floating wind farm, assuming a streamlined and efficient manufacturing of the floater and mooring system, and further development of the other cost elements. Numbers from a detailed UK study of a hypothetical floating wind farm to be installed by 2028 are included as state of the art for comparison.
| Cost element | State of the art MNOK/MW | Future MNOK/MW | Comment |
| Development expenditure | 2.6 | 0.8 | Assumed as land-based (5% of 16 MNOK/MW) |
| Wind turbine | 22.3 | 4.1 | Assumed as land-based + 25% for marinisation |
| Floater | 16.5 | 2.6 | Hull (1.9 MNOK/MW) + ballast (0.7 MNOK/MW) |
| Mooring system | 3.1 | 0.6 | Chain and anchors |
| Inter-array cables | 2 | 1.5 | 25% cost reduction based on new technology (lead-free wet design) |
| Offshore substation | 2.6 | 1.3 | 50% cost reduction based on new technology (subsea substation) |
| Export cable (60 km) | 3.4 | 2.6 | 25 % cost reduction based on new technology (lead-free wet design) |
| Onshore substation | 1.4 | 1.3 | 10% cost reduction through development |
| Installation and commissioning | 6.4 | 3.2 | 50% cost reduction with more streamlined process & automation |
| Contingency and assurance | 4.6 | 2.0 | Approx. 10% of total investment |
| Total investment | 64.9 | 19.9 |
Example calculation of LCOE for floating wind farm
Calculations of LCOE is prepared for three sets of wind conditions, at assumptions on discount rate (5%) and lifetime (25 years) as would be relevant for a societal cost calculation, while for comparison a calculation on “commercial” conditions is also included with a discount rate of 10% and a lifetime of 15 years.
The operation and maintenance cost (O&M = OPEX) is assumed to be cut significantly, from 1.1 MNOK/MW/y to 0.5 MNOK/MW/y. The reasoning is that more robust components will be developed that require less maintenance and repair. In addition, systems for improved access and marine operations will be developed, digitalisation will be implemented, and systems for remote monitoring and inspections will be put to use. Systems for early warning of failures and condition-based maintenance, will also be developed. Together, all these improvements will result in significant reductions in OPEX.
The assumptions and resulting LCOE is summarised in the table below.
| Floating wind farm | Low wind | Base | High wind | Commercial |
| Annual average wind speed (m/s) | 10.6 | 11.5 | 12.4 | 11.5 |
| Full load hours (h) | 4822 | 5085 | 5261 | 5085 |
| Investment (MNOK/MW) | 20 | 20 | 20 | 20 |
| Investment support (%) | 0 | 0 | 0 | 0 |
| Discount rate (%) | 5 | 5 | 5 | 10 |
| Lifetime (y) | 25 | 25 | 25 | 15 |
| Investment (øre/kWh) | 29 | 28 | 27 | 51 |
| O&M (MNOK/MW/year) | 0.5 | 0.5 | 0.5 | 0.5 |
| O&M (øre/kWh) | 10 | 10 | 10 | 10 |
| LCOE (øre/kWh) | 40 | 38 | 36 | 61 |
As the table demonstrates, under the assumptions we have made, floating wind can be developed into a cost-competitive source of energy. The results are in line with previous estimates by the industry, for example in the ETIPWind report. Costs can be reduced to this level by deployment, research and innovation.
- Deployment referring to the construction of floating wind farms, both for demonstration and scale-up, is vital for the development of the industry and an efficient supply chain.
- Research and innovation are needed to optimise design, manufacturing, assembly and installation, but also to develop methods to streamline processes in development, operation, and maintenance.
At which time the cost can be brought down to the level shown here depends on the policies that are put in place to support deployment, research and innovation. Deployment, supported by research and innovation, drives cost down, while policies determine the speed of the development.
Acknowledgement
This blog article is based on the memo “Cost of floating wind energy” written by former NorthWind director John Olav Tande, 28 Oct. 2024.


Comments
“Hybrid Wind Wave Energy”, AWWE, and 4Wind1Wave are both technologies that can give us float wind energy at € 0,05/kWh.