We are very proud of presenting the work that we have carried out over the last 15 months together with IFP Energie Nouvelle and Deloitte – the Hydrogen4EU/Hydrogen for Europe study. Below I am presenting the 6 minutes snapshot of the study to give you an overview of its main features and results. The report in its entirety can be found here, together with the executive summary.
The Hydrogen4EU study has been a comprehensive effort in analysing pathways for the European transition to climate neutrality by 2050. The goal was to assess the most cost-efficient transition pathways, as well as the role of hydrogen within these. The research of the study was funded by 17 partners: BP, ConocoPhillips, Concawe, ENI, Equinor, Ervia, ExxonMobil, Gassco, Hydrogen Europe, IOGP, Norwegian Oil & Gas Association, OMV, Shell, Snam, Total, Wintershall Dea, Zukunft Gas.
Data from the entire energy system
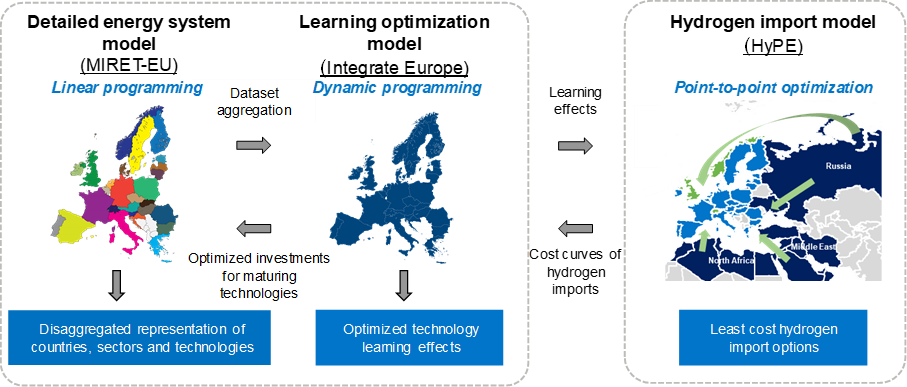
In the study we analysed the entire existing energy system as shown in Figure 1. We updated our frameworks to include the relevant hydrogen technologies with state-of-the-art performance data. The study relies on a comprehensive database for all included technologies.

Realising that the relevance of the results of this kind of study hinges partly on the implemented energy policy framework, we included a comprehensive set of the implemented policies. Furthermore, for greenhouse gas emissions we applied a 55% reduction target for 2030 (compared to 1990 levels) and a net-zero target for 2050, in line with EU targets under the Green Deal and Climate Law.
Two decarbonisation scenarios
These policies and emissions reduction targets constitute the foundation for our main scenario, named “Technology Diversification”. We also included an additional scenario named “Renewable Push”, where there is a policy with elevated targets for consumption of renewable energy from 2030 to 2050.
In the study, we used two energy system models to capture both geographical and technological details as well as cost reductions due to technology investments and deployment rates (the so-called learning-by-doing effect). We also included a designated model for assessing the cost of hydrogen imported from outside Europe.
The results of the study should not be seen as forecasts for how the European energy system will evolve towards 2050. What this study does is to identify the optimal transition pathways for a given scenario. As described above, we have included two different scenarios, and the results for each scenario represent the cost-optimal transition pathways for the conditions set up within the scenario. Comparing the results of different scenarios allows us to analyse the effects of different policy set-ups (for example) to see the main similarities between the scenario outcomes, and the biggest differences.
What this study does is to identify the optimal transition pathways for a given scenario.
The results
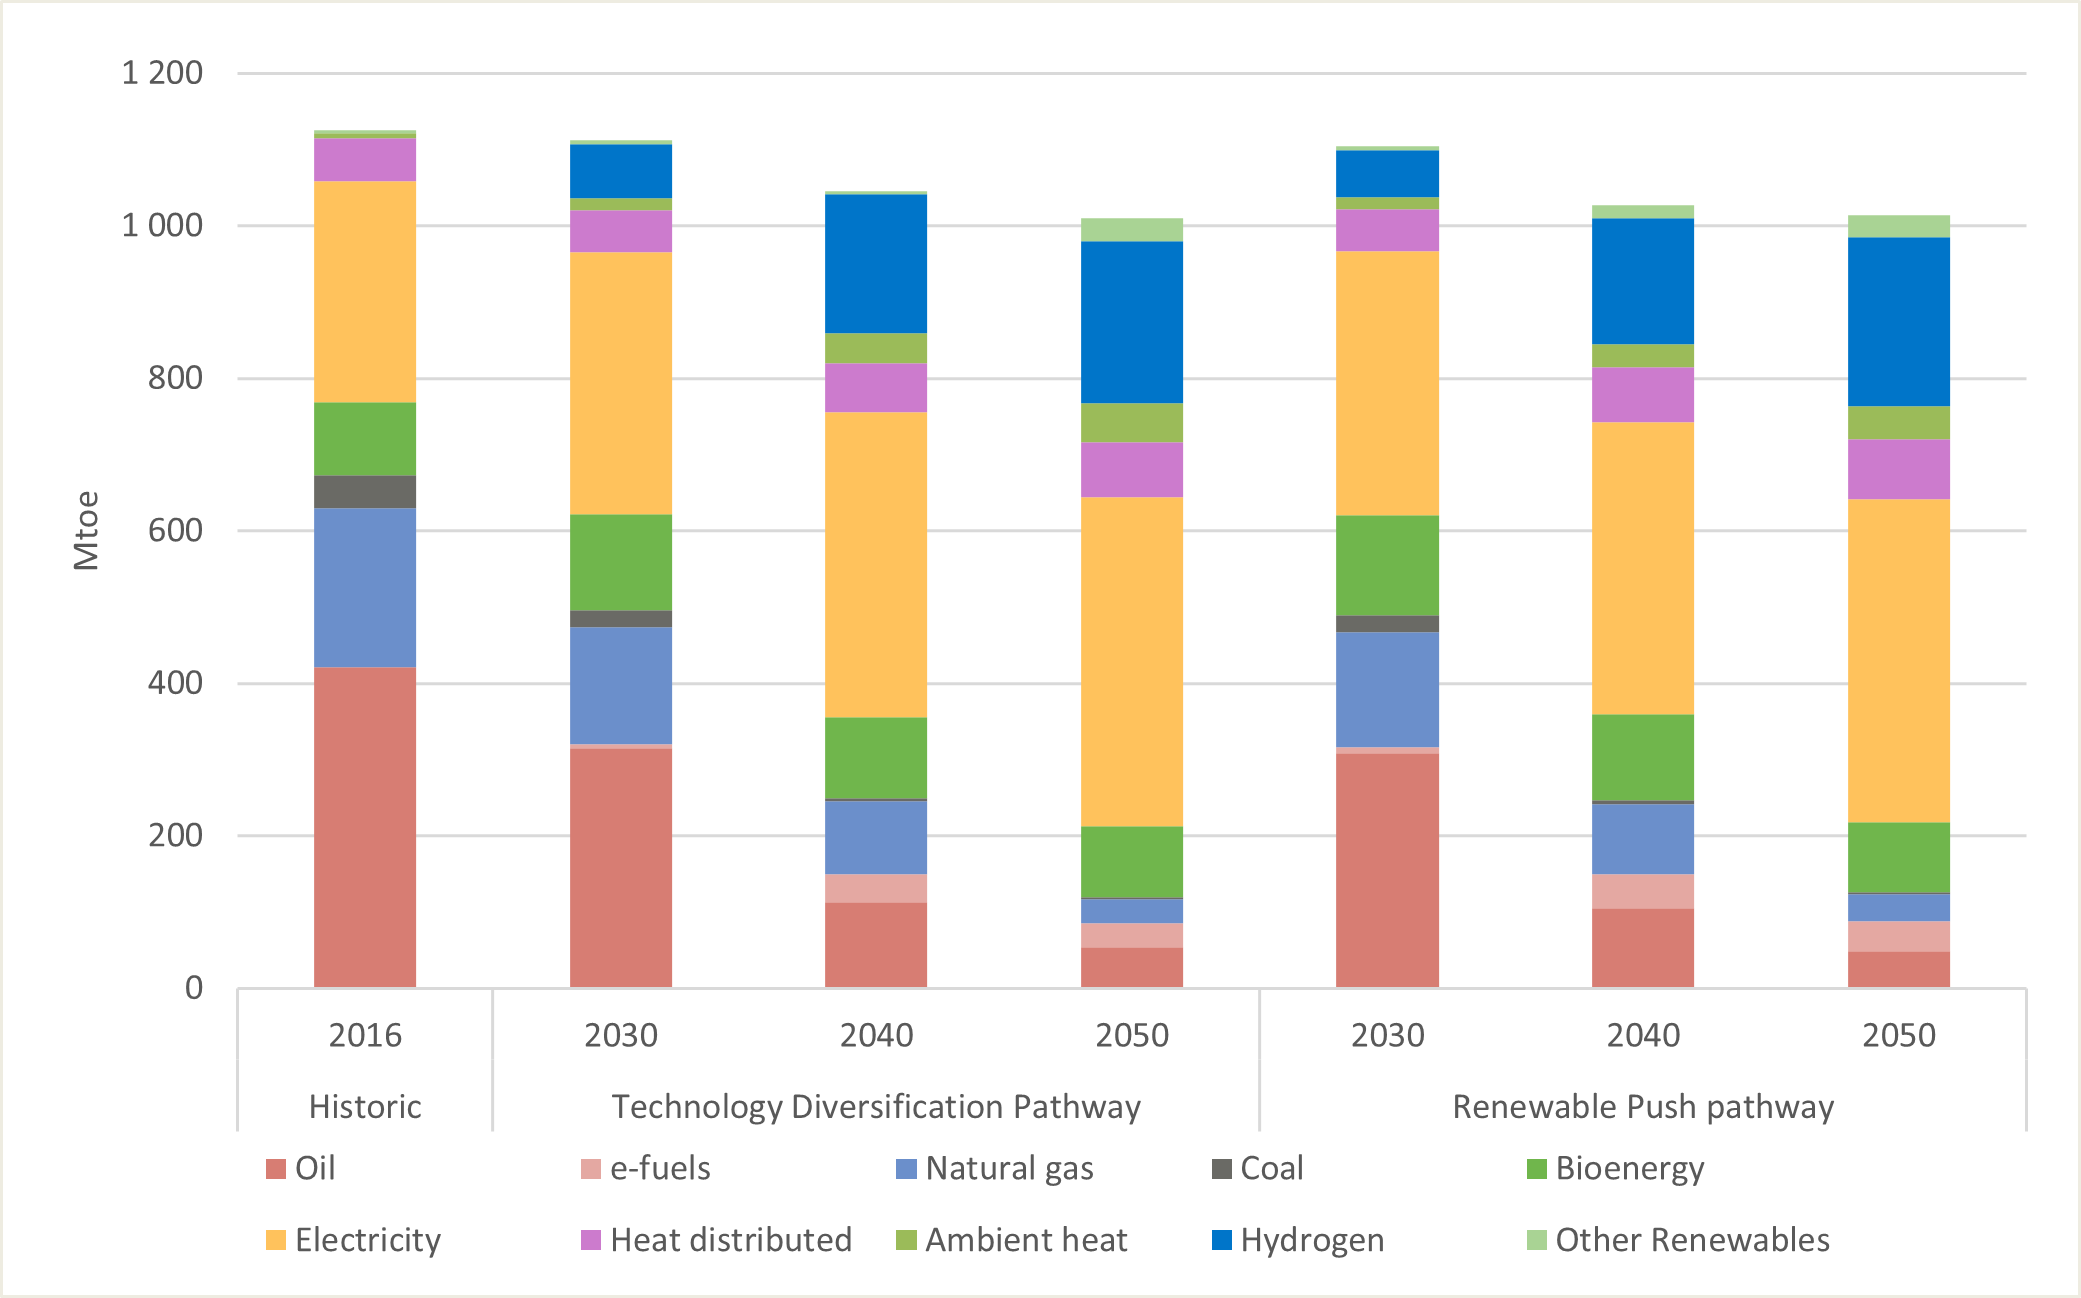
Figure 3 presents the development in gross final energy consumption for both the Technology Diversification and the Renewable Push pathways. Comparing the results of the two scenarios, we see that the overall trends are similar. The share of electricity consumption increases by 26 percentage points and 27 percentage points, respectively. The use of coal, oil and natural gas diminishes. And hydrogen enters the scene with increased use towards 2050.
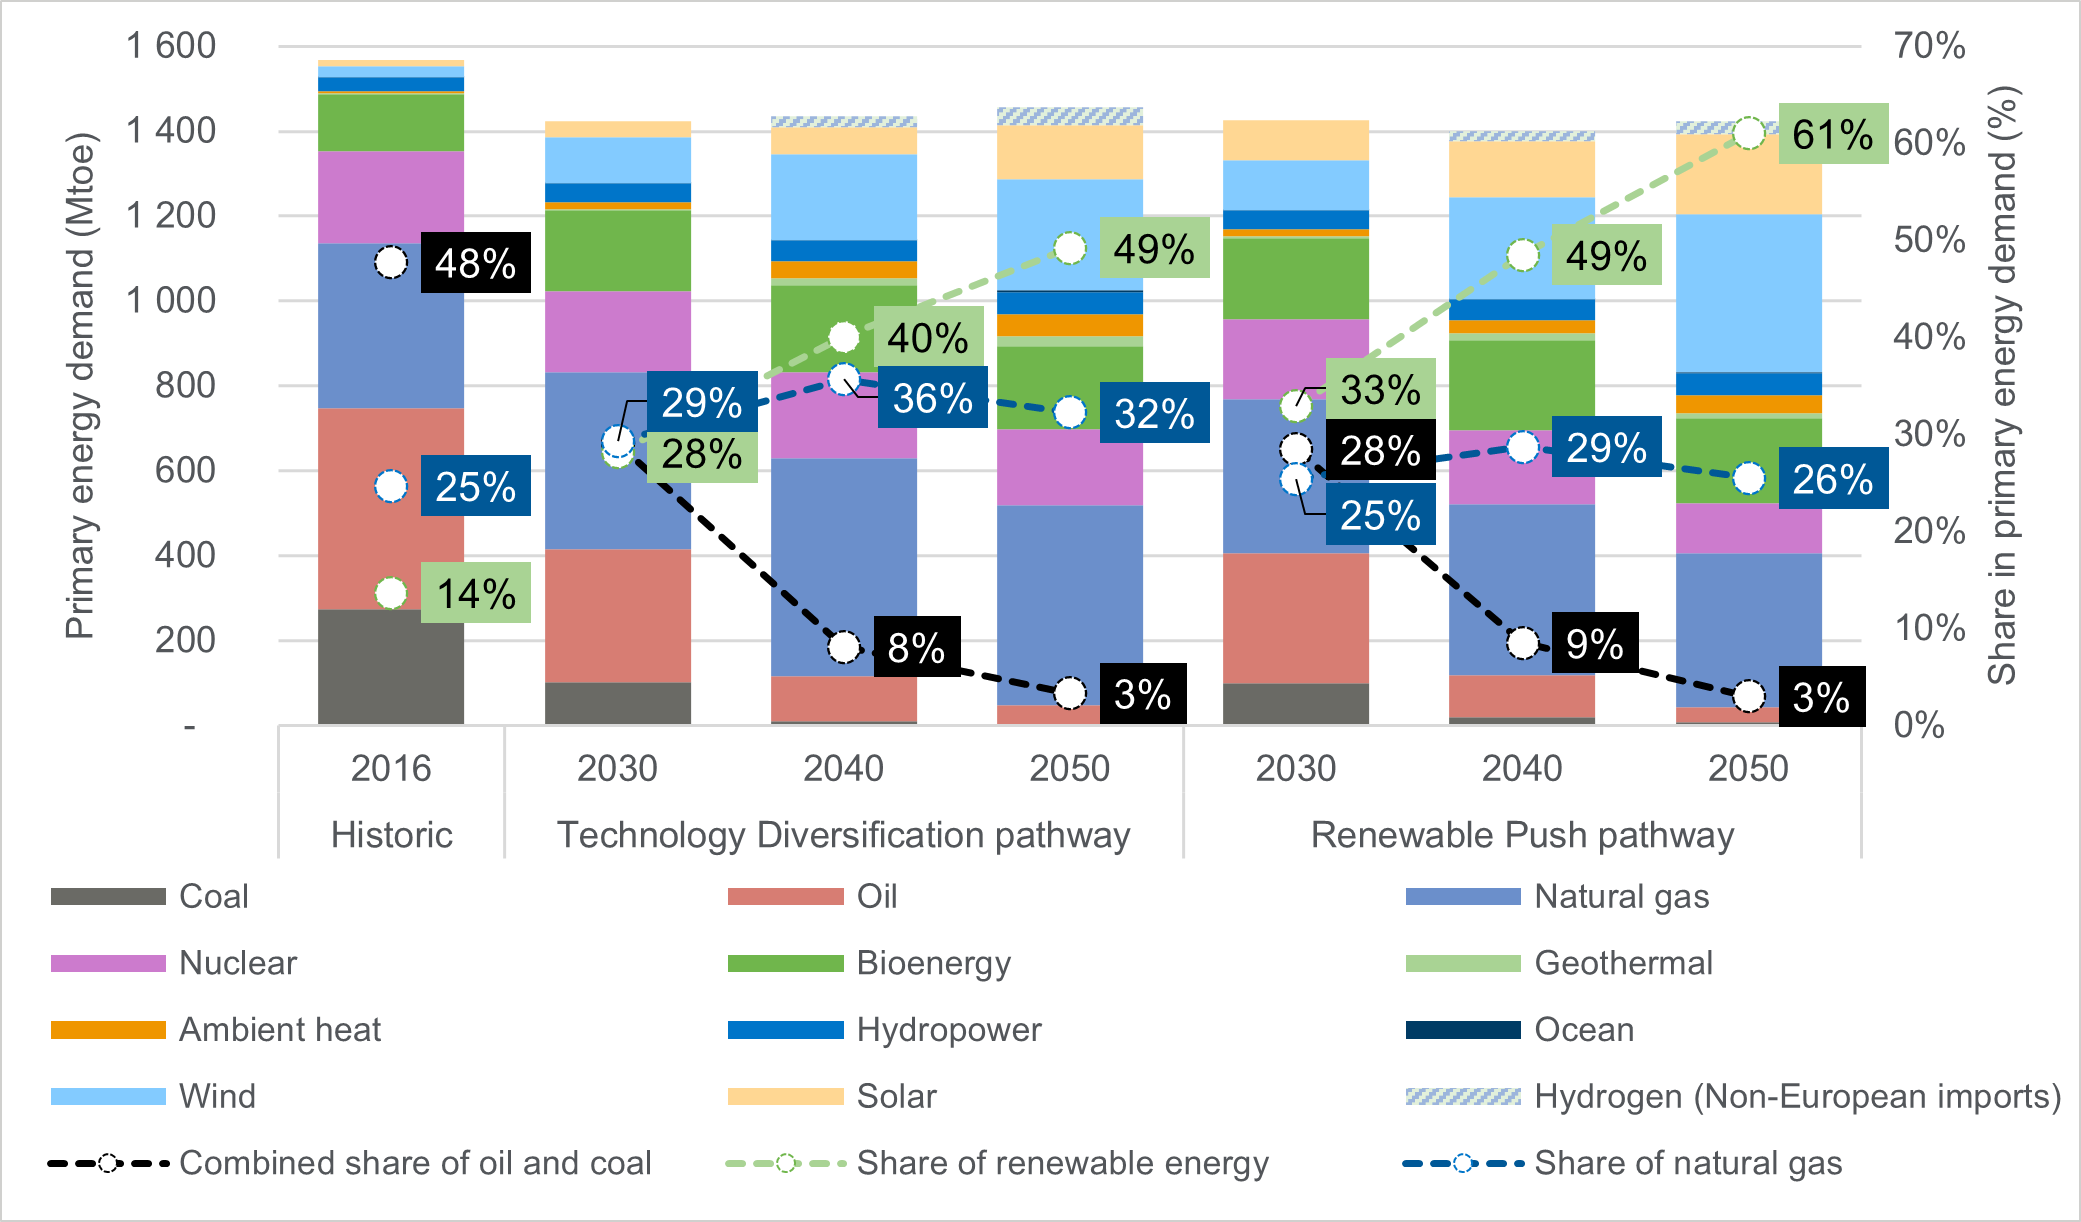
The evolution of the primary energy demand is more sensitive to scenario set-up, as can be seen in Figure 4. The largest difference is seen for the share of renewable energy, which is clearly affected by the difference in related policies between the two scenarios. In contrast, the share of oil and coal is seen to follow very similar trajectories and reaches 3% by 2050. The evolution of the share of natural gas in the primary energy is also noteworthy. As can be seen, despite the steady decline within the gross final energy consumption, the share of primary energy demand is more stable. This is because natural gas is used within the energy system to produce electricity and hydrogen, where 86% and 95%, respectively, of the associated CO2 is captured and permanently stored.
Looking into production technologies for hydrogen, we see that the mix of technologies is similar, but with a significant difference towards 2050 in the proportion of hydrogen produced via natural gas and electrolysers.
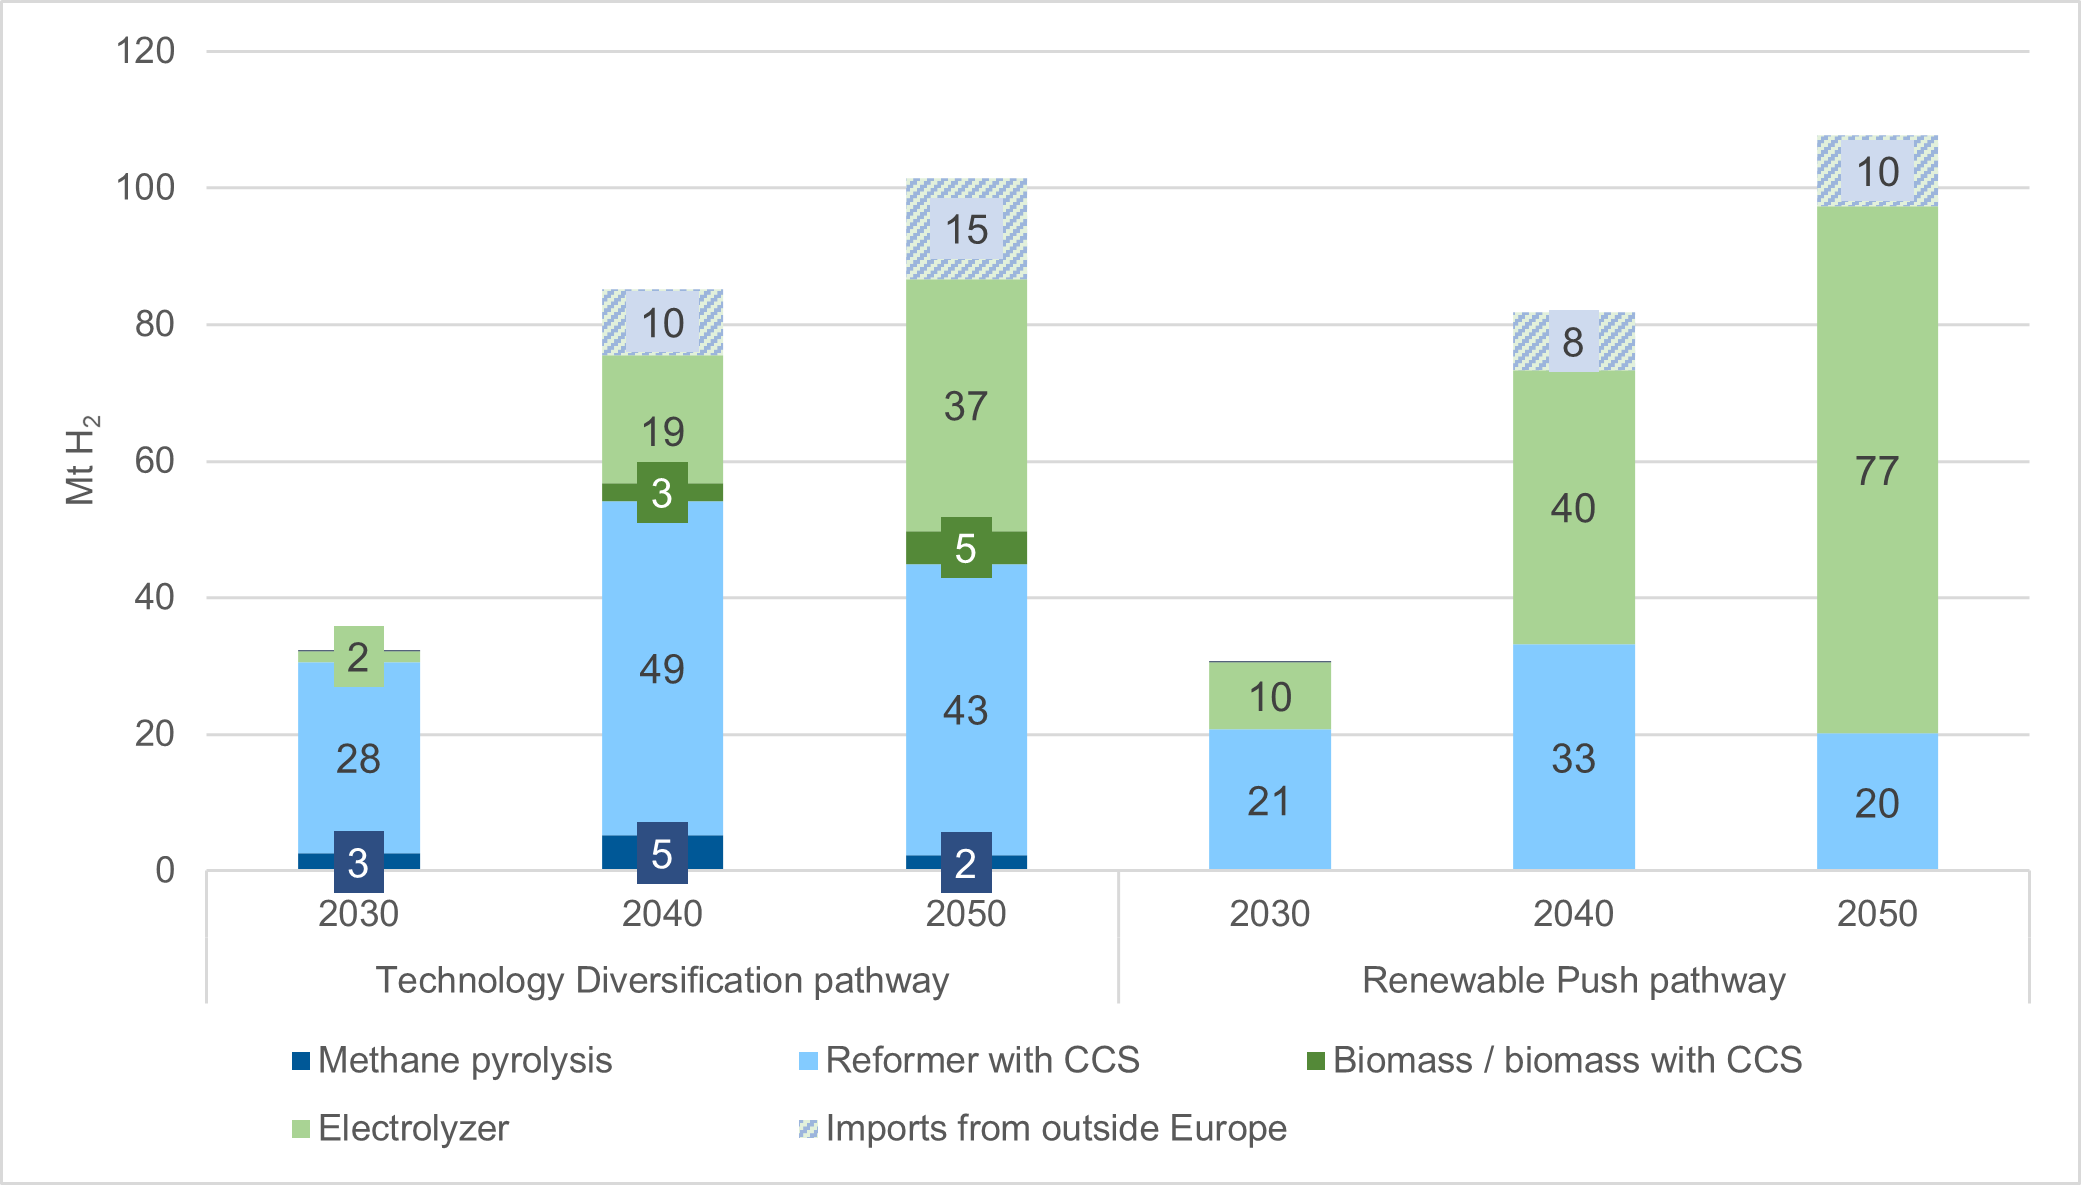
In the 2030 investment period, hydrogen production based on reforming of natural gas with very low emissions of CO2 to the air (95% of the produced CO2 is captured and permanently stored) establishes the emerging hydrogen market. Towards 2050, the share of hydrogen produced by electrolysis increases steadily. Comparing the results of the two scenarios reveals the impact of policy for renewable energy implemented in the Renewable Push pathway, where the main impact is seen in the higher share of hydrogen produced via electrolysers. The overall hydrogen demand is also slightly higher under this policy regime.
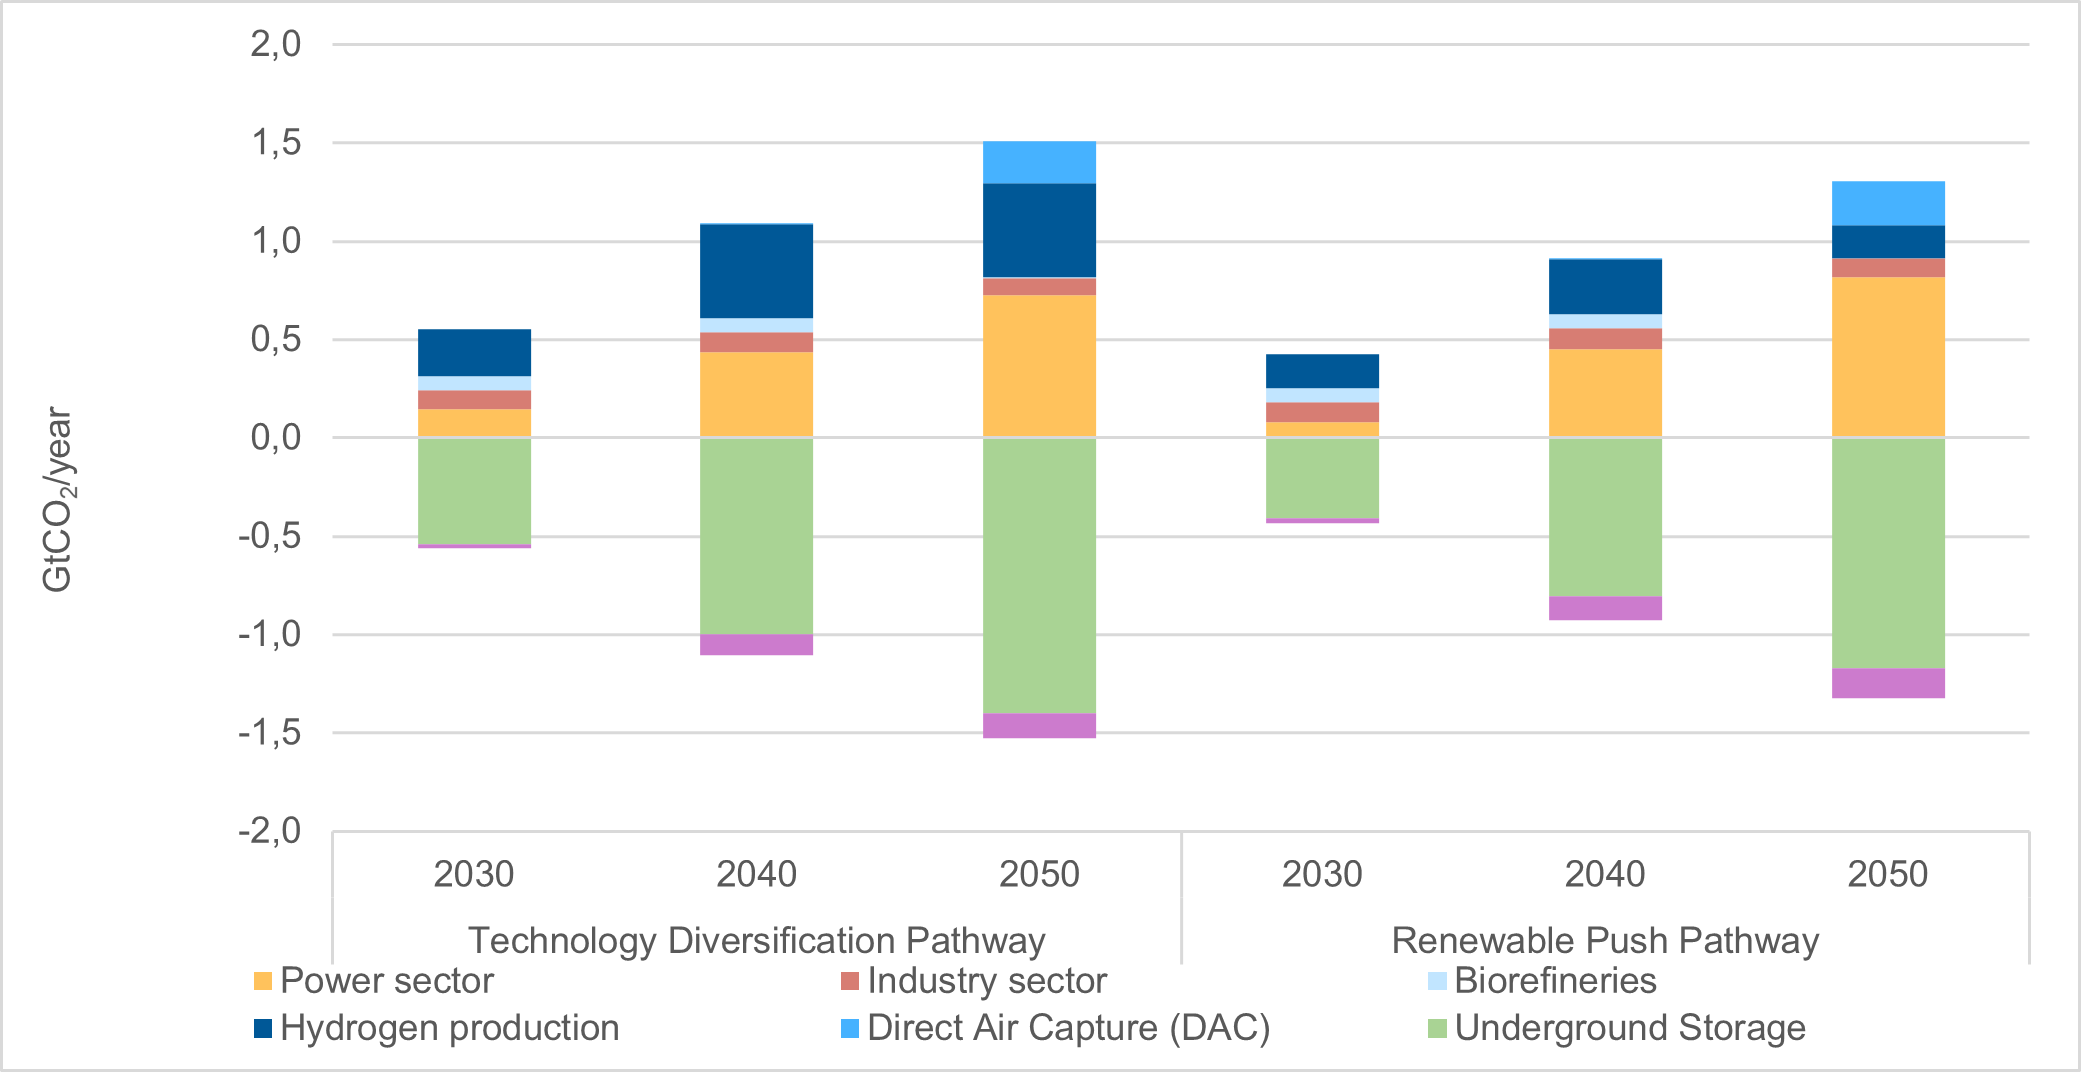
Permanent storage of CO2 is an important part of the cost-optimal transition pathways. As presented in Figure 6, the most cost-efficient pathways include as much as 400 Mt to 500 Mt of CO2 stored permanently on an annual basis. Having this annual storage capacity would require the equivalent of approximately 300 Longship projects, which is the Norwegian Government’s full-scale carbon capture and storage project. By 2050, the storage demand increases to 800 to 900 Longship projects for the two scenarios.
Permanent storage of CO2 is an important part of the cost-optimal transition pathways.
As stated earlier, these results are not forecasting the future pathway of the European energy system development. A key outcome of the study is that it has shown the unprecedented change that is needed to reach climate neutrality by 2050. To succeed, we need all the options available for reducing our greenhouse gas emissions.
- Electrification and deployment of large amounts of electricity production from solar and wind is needed. We need to develop a hydrogen market,
- to scale up the electrolyser capacity to produce hydrogen from renewable resources,
- and to deploy infrastructures for CCS. These technologies are cornerstones for both scenarios.
However, the Technology Diversification scenario shows us the benefit of a technology-neutral approach for the hydrogen sector. When the development of this market is less constrained, the added flexibility of using a variety of hydrogen production mixes increases the robustness of the transition and reduces the overall costs. Compared to the Renewable Push pathway, the Technology Diversification pathway allows for average annual savings of more than €70 billion in total energy system costs.
To succeed, we need all the options available for reducing our greenhouse gas emissions.
Return on invested energy EROI, also called EROEI, has been applied to many (clean) energy producing prosesses.
How does hydrogen fit in here?
In the HydrogenEU study we have not included full life-cycle assessments and thus no calculations of EROEI for hydrogen, unfortunately. I observe that there exist a few publications on the topic with “Life-cycle net energy assessment of large-scale hydrogen production via photoelectrochemical water splitting” by Sathre et al. (Energy & Environmental Science, 2014) as the most relevant. They report an EROEI of 1.7 for large-scale photoelectrochemical (PEC) hydrogen production facility.
Pingback: Video: SINTEF Energi 2021 oppsummert på fem minutter - #SINTEFblogg