Rapid Phase Transition (RPT) is an explosive event that can occur when LNG spills onto water. RPTs are not explosions in the common sense, i.e. there is no fire. Rather, these events are so-called vapor explosions caused by abrupt and simultaneous evaporation of a larger amount of LNG. The phenomenon occurred in approximately one-in-three large-scale tests. The tests also revealed that the explosive yields may be significant, up to several kilogram of TNT equivalent.
There is an established distinction between Early RPT, which occurs in the mixing-region beneath jet impact, and Delayed RPT, which occurs above water in the spreading LNG pool:
Prediction of Early RPT remains an unsolved problem, while prediction of Delayed RPT is possible to some extent. The latter has been the main focus of the Predict-RPT project. Now the project has drawn to a close, we’re pleased to present our main recommendations based on our findings on the risk for so called delayed LNG RPTs. We will also provide case study results that are relevant for spills of LNG from loading arm failures for large LNG fuelled vessels and LNG carriers.
Main observations and recommendations
In Predict-RPT we developed a methodology for estimating when the criteria for Delayed RPT are met.
Given a plausible range of LNG compositions we came to the following general conclusions:
- The LNG must boil down to approximately 30-50 mol% methane before meeting the condition for delayed RPT triggering.
- By the time the triggering condition is met, only 10-20% of the original amount of LNG is remaining.
Further, a methodology for estimating the consequence of LNG RPT has been developed. Given a plausible range of LNG compositions we came to the following general conclusions:
- The predicted explosive yield from LNG RPT is in the range of 50-80 kJ/kg, which is equivalent to about 12-20 g TNT per kg LNG. In terms of spilled liquid volume, this is about 5-10 g TNT per litre. Note that the predicted yield is only found in terms of energy per LNG amount that participates in the RPT event. There is currently no method of predicting the exact amount of LNG that will participate in a single RPT event. However, as will be shown in the case results, it is possible to estimate the amount of LNG that is in the risk zone for RPTs.
- The predicted peak pressure (near source) from an LNG RPT is in the range of 20-60 bar.
A guide on how to perform the risk assessment for a specific LNG mixture is presented here and implemented in our webtool.
Rick mitigation measures
Based on the theory developed in Predict-RPT, we suggest the following risk-mitigation measures:
- Adjust the LNG composition to make the alkane factor, which is average molar mass of the non-methane part of the mixture relative to the moral mass of pure ethane, as small as possible. This reduces both the risk and consequence of RPT, and if it is below 1.1 triggering should be very unlikely. Typical LNG mixtures generally yield values in the range 1.1 to 1.4.
- Reduction of the alkane factor is achieved by reducing the amounts of the heavier alkanes (propane, butane, …) relative to the amount of ethane.
- Make the methane-fraction of the LNG as high as possible. This should preferably be done without conflicting with the point above, i.e., without reducing the amount of ethane relative to the heavier components.
Simulation results for spills of LNG from loading arm failures
As illustrated above, there is a risk of an LNG spill onto water from a failing loading arm. To estimate the risk for delayed RPTs, a simulation framework has been developed within the Predict-RPT project. In the following we will present simulation results and a corresponding risk analysis for delayed RPTs for two different scenarios
- Spill from the loading arm of a larger LNG fuelled vessel
- Spill from the loading arm of an LNG carrier
Volume, radii, and duration of the two different spills are summarised below. The spilled LNG is assumed to consist of 90 % methane, 7.5 % ethane, and 2.5 % propane (mass fractions) in both cases. The parameters have been used as input data to the simulation framework which combines state-of-the-art models for spreading of LNG on water, heat-transfer to the LNG and thermodynamic relations.
Spill scenario details:
| Scenario | Flowrate of spilled LNG [m3/h] | Radius of spill [m] | Duration of spill |
| LNG fuelled vessel | 2000 | 0.10 | 30 s |
| LNG carrier | 8000 | 0.20 | > 30 s (steady state) |
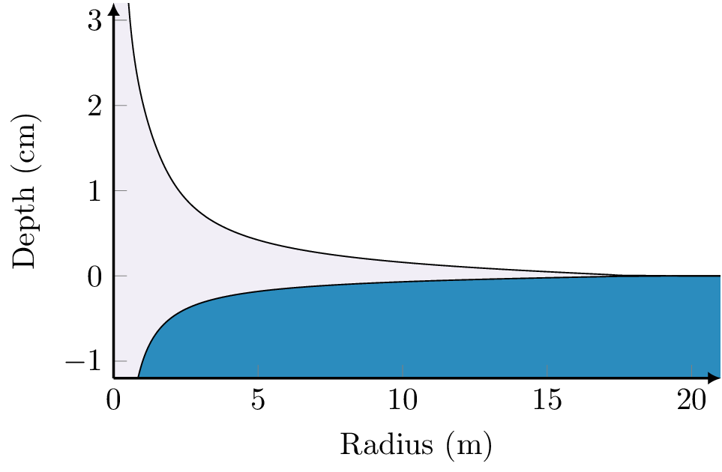
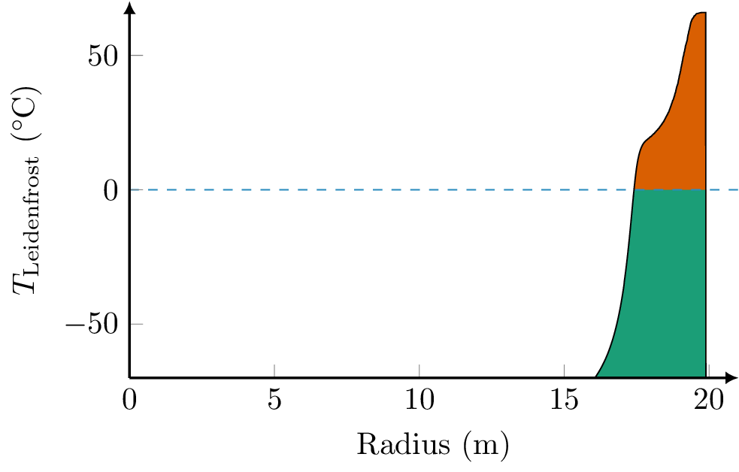
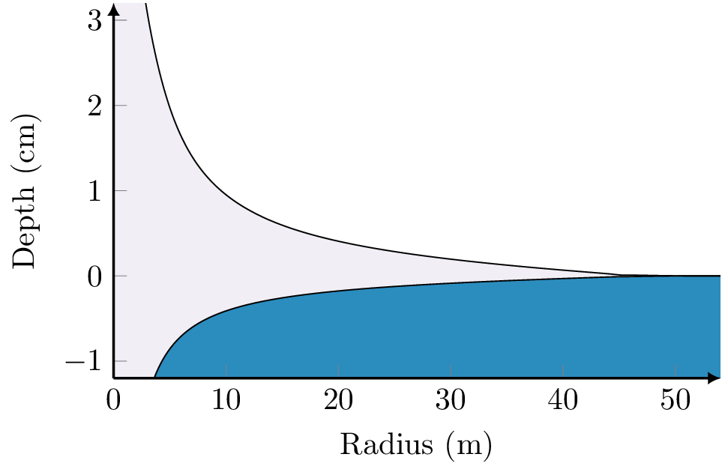
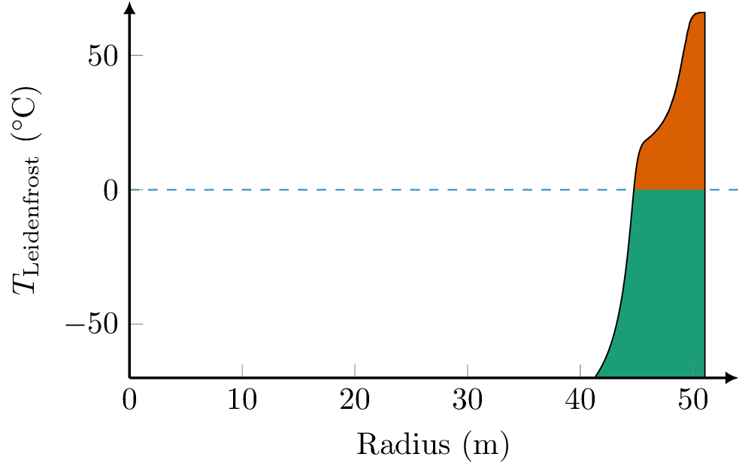
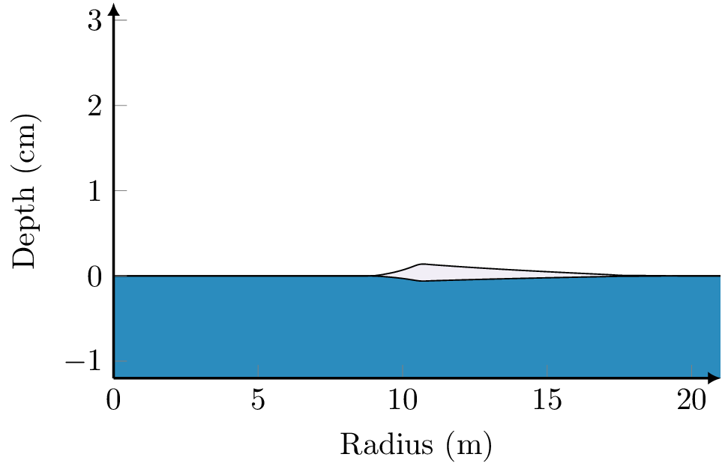
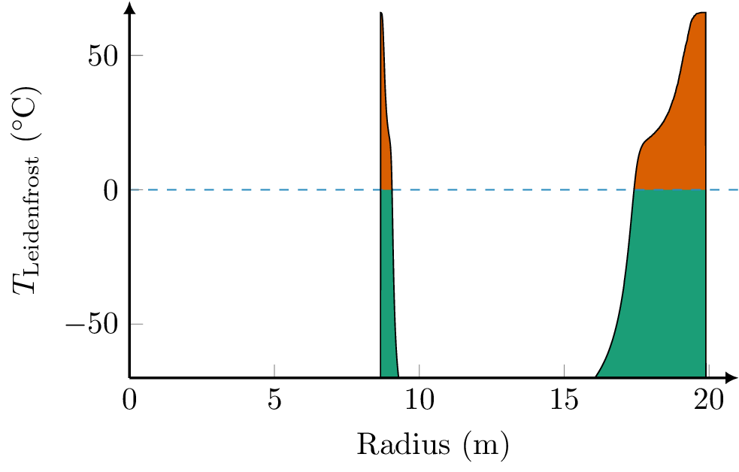
The following graphs and table present the results from the simulations. The graphs show the height profile of the spilled LNG at a) steady state during the spill and b) at a time near the conditions for the largest potential for release of energy in an RPT. The latter condition occurs after the spill has ended and is only presented for the spill case related to the LNG fuelled vessel.
The graphs also show the corresponding temperature profiles in the LNG spill and indicate the segments of the LNG with Leidenfrost temperate such that the LNG is within the risk zone for RPT. For further explanation, see more on the criterion for the RPT risk zone further down the page.
Case study results: RPT risk zone and potential consequence:
| Peak pressure [bar] | Mass LNG in RPT risk zone [kg] | Specific energy of LNG in RPT risk zone [kJ/kg] | Time until LNG enters risk zone [s] | |
| LNG fuelled vessel, steady state | 23,8 | 7,5 | 52,7 | 14,4 |
| LNG fuelled vessel, max RPT potential | 23,8 | 9,5 | 52,7 | 14,4 |
| LNG carrier, steady state | 23,8 | 85 | 52,7 | 24,6 |
The simulation results show that the spill rate determines the time until LNG first reaches the RPT risk zone, and the amount of LNG in the risk zone. The peak pressure and the potential yield per mass of LNG is only determined by the LNG composition, and hence equal for the two spill scenarios currently selected.
A comparison of the following graphs reveals that the risk zone of RPT occurs at the outer part of the spill for both spill rates:
When the spill ends, and the steady state condition ends, a tail with LNG in the risk zone is created, as can be seen below. This results in an increase of LNG within the risk zone for RPT. The maximal amount of LNG within the risk zone is estimated to be approximately 27 % higher than at steady state conditions.
What is a rapid phase transition and how does it occur?
When LNG is spilled into water it will in most cases eventually boil off without further incident. However, in some cases it is observed to suddenly, and seemingly at random, undergo a localised explosive vaporisation. This is an RPT event and is considered one of the main safety concerns of the LNG industry. Still, the attention given to RPT risk in LNG safety reviews is highly variably, ranging from significant discussion to little more than a brief mention.
RPT is not an explosion in the common meaning of the word, since it does not involve combustion or other chemical reactions. RPT events are what is sometimes called a vapor explosion or a physical explosion. It is still destructive in nature and poses a danger to both people and equipment. Its peak pressures and released mechanical energy can be large enough to displace and damage heavy equipment and could theoretically cause secondary structural damage and cascading containment failures.
Whether or not an RPT event will occur in any given spill has been notoriously difficult to predict. From extensive tests performed by LLNL in the 1980s it was found that RPT occurred in about one third of spills. It was also observed that a single spill may lead to more than ten distinct RPT events. The yields of single RPT events seem quite random and may apparently have TNT equivalents of anything from a few grams to 6 kg (about 25 MJ).
This is the general macroscopic chain-of-events of a marine LNG spill:
- Containment breach: Due to some unintended event, the containment of LNG in a tank or transfer line is broken. If the breach is above sea level, the LNG may fall towards the water surface in the form of a jet.
- Jet impact: The LNG jet impacts the water surface, which will break it up into separate droplets.
- Droplet/water mixing: If the momentum the jet is large enough, the droplets will initially penetrate the surface and become submerged in water. This forms a chaotic mixing region.
- Pool formation and spreading: Since the density of LNG is about half of that of water, the droplets will be buoyant and will eventually rise to the surface. This forms an LNG pool that spreads on top of the water surface.
- Boil-off: The boiling point of LNG is at about -162 °C, while the water holds a temperature of about 0 °C, so the spreading pool will start boil while spreading. Since methane is by far the most volatile component, the resulting vapor is almost purely methane. This causes a gradual compositional change, which increases the relative amounts of the heavier alkanes such as ethane, propane and butane.

As indicated in the figures, there is an established distinction between two kinds of RPT events depending on when and where it occurs in a spill event:
- Early RPT: This is defined as any RPT that occurs in the mixing region at any time during the spill event.
- Delayed RPT: This is defined as any RPT that is not an Early RPT, which means that it must occur somewhere in the spreading pool, not in the mixing region. Reports indicate that Delayed RPT only occurs a considerable time (on the scale of minutes) after the start of the LNG spill event.
After the possibility of LNG RPT was discovered in the 1960s, a handful of research groups went to work on understanding the mechanisms behind the phenomenon. By the first half of the 1970s, they had arrived at a general consensus for a theory of RPT. This is a theory about what occurs on the small scales at the local time and position where a single RPT event is observed, and is relevant for both early and delayed RPT. The theory may be summarized by the following chain-of-events:
1. Film-boiling stage: The temperature difference between the sea water and the LNG is so large that boiling occurs far into the film boiling regime. This means that the LNG pool or droplet is insulated from the water by a vapor film consisting mainly of methane. Because of this the heat flux stays relatively low and the evaporation stays in a quasi-equilibrium regime. All of the energy transferred into the LNG is spent on evaporation, and the LNG temperature stays close to the bubble-point, which is initially about -162 °C.
2. Film-boiling collapse (liquid-liquid contact): For some reason there is a sudden and localized film-boiling collapse. The suggested mechanisms for film-boiling collapse will depend on whether one is considering early or delayed RPT. In either case, this means that there is considerable direct contact between the water and the LNG, which increases the heat flux by orders of magnitude.
3. Rapid superheating to the superheat limit: Because a liquid-liquid interface has relatively few nucleation sites, the evaporation rate is initially unable to keep up with the dramatic increase in heat flux. Instead, much of the heat is spent on superheating the LNG, which means that the liquid is heated significantly beyond its boiling temperature. The superheated liquid is in a meta-stable state and may transition to its corresponding equilibrium state if disturbed. If not disturbed sufficiently, there is a maximum temperature at which the liquid must transition regardless of external disturbances. This is called the superheat limit.
4. Homogeneous nucleation: Once the liquid approaches its superheat limit, vaporization spontaneously occurs throughout its volume by homogeneous nucleation. This is the start of a rapid transition from a liquid state to a two-phase state.
5. Explosive expansion: If in mechanical equilibrium with its surroundings, the new state would take up over 100 times the volume of the original superheated liquid state. The fluid is initially forced to fit in the original volume, so the pressure increases dramatically before it has time to expand. Since this transition happens fast, it is observed as a loud and destructive vapor explosion. The event involves high-pressure waves and considerable energy release through expansion work.
Predicting triggering and consequences of RPT
The main challenge when predicting the occurrence of RPT is predicting step two, the sudden film-boiling collapse and subsequent liquid-liquid contact. We refer to this as the triggering event. The approach depends on whether one considers early RPT (droplet boiling) or delayed RPT (pool boiling).
For delayed RPT, the relevant mode of boiling is pool boiling. This is usually quantified in terms of the boiling curve, sometimes called the Nukiyama curve after the person who first characterised it back in the 1930s.
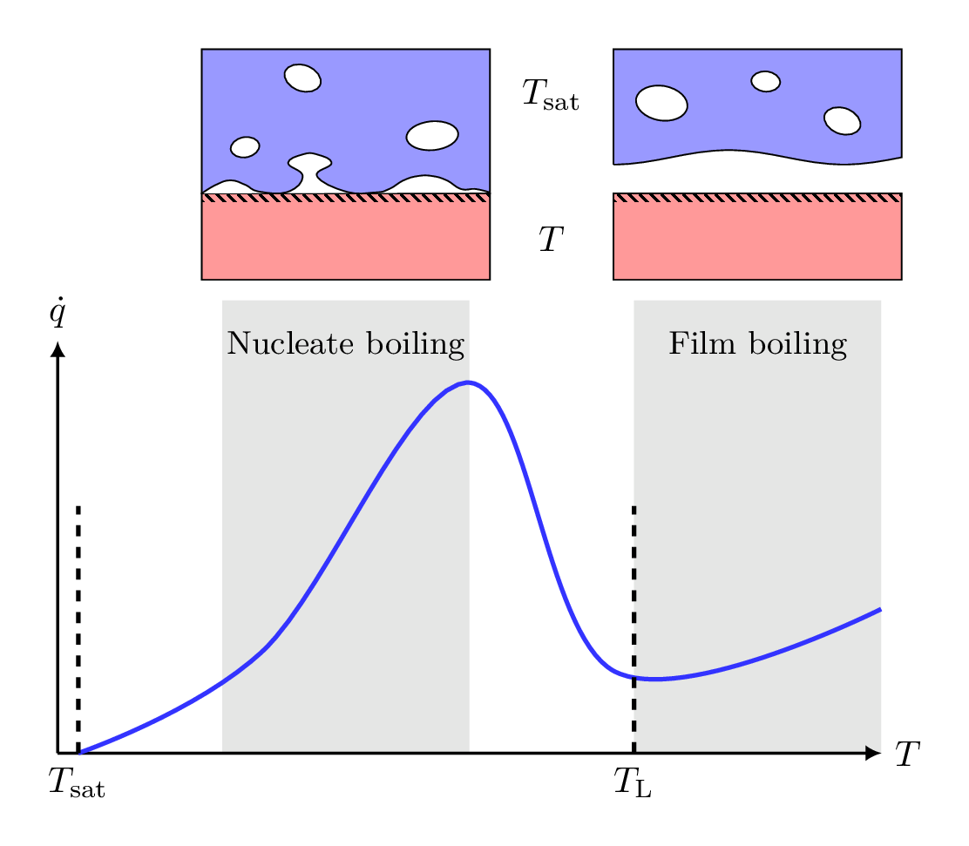
In the present case, LNG takes the role of the boiling fluid and water takes the role of the hot surface. According to the theory described above RPT is triggered on film-boiling collapse, which for pool boiling is defined by the position on the boiling curve. Hence for Leidenfrost temperatures (TL) below the water temperature (Tw), there will be film boiling and no RPT will occur. For Leidenfrost temperatures above the water temperature there will be liquid-liquid contact between the LNG and the water and there is a risk for RPT.
The Leidenfrost temperature of a fluid such as LNG is difficult to predict (or even measure) with good accuracy, but it has generally been found that it is close to, but slightly below, the fluid’s critical temperature:

The critical point of a typical LNG mixture is in the region of Tcrit ≈ 203 K (-70 °C). By comparison,
since the water is normally not observed to freeze in large-scale LNG spills, the surface holds a temperature of approximately Tw ≈ 0 °C. This means that we are safely in the film boiling regime with no risk for RPT.
However, this is only true for LNG with its initial (stored) composition. As boil-off proceeds, the composition changes in such a way that the critical temperature of the mixture increases. Hence, the Leidenfrost temperature will also increase. Eventually it reaches the water temperature, which gives a risk of RPT.
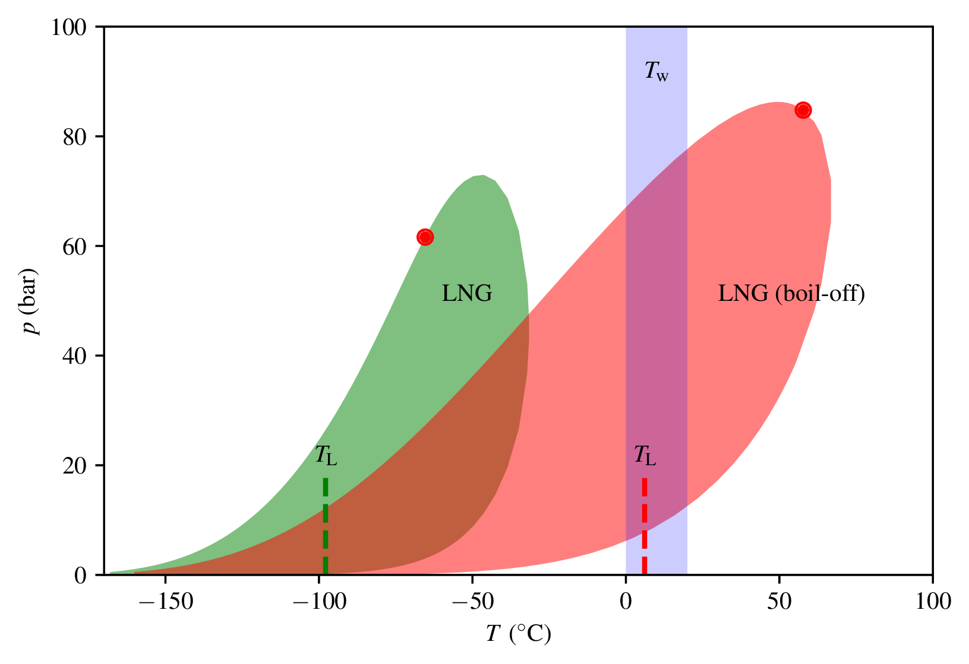
Thus, the challenge of predicting the triggering of delayed LNG RPT is reduced to the prediction
of when and where the condition TL > Tw may be satisfied. In our previous work this was analyzed extensively in terms of the methane fraction necessary to satisfy the triggering criterion. In short, the results were:
- The LNG must boil down to approximately 30-50 mol% methane before meeting the condition for delayed RPT triggering (TL ≈ Tw). This depends on the relative amounts of the heavier alkanes.
- By the time the triggering condition is met, only 10-20% of the original amount of LNG is remaining.
So-called early RPT occurs in the chaotic mixing region beneath the point of LNG jet impact. This region contains film-boiling LNG droplets submerged in water, which initially move downwards due to inertia but eventually move back to the surface due to buoyancy.
According to the general theory of RPT presented above, the triggering event is initiated by sudden significant liquid-liquid contact. Predicting this for early RPT is much more difficult than in the case of delayed RPT, since the degree of liquid-liquid contact is no longer governed by a simple boiling curve. In this case it would require a detailed multi-phase simulation of the mixing region over sufficiently long timescales.
This has to our knowledge not been achieved, and we consider early RPT an unsolved problem in the LNG industry.





Comments
No comments yet. Be the first to comment!