Changing to non-emission transport can result in approximately 1.5 mill. private electric vehicles by 2030, resulting in an energy need of 4 TWh. This represents a 3% increase of the Norwegian electricity consumption. This blog presents results from the CINELDI-ModFlex-project, evaluating the consequences of the increasing share of electric vehicles and the potential for demand response and flexibility in charging.
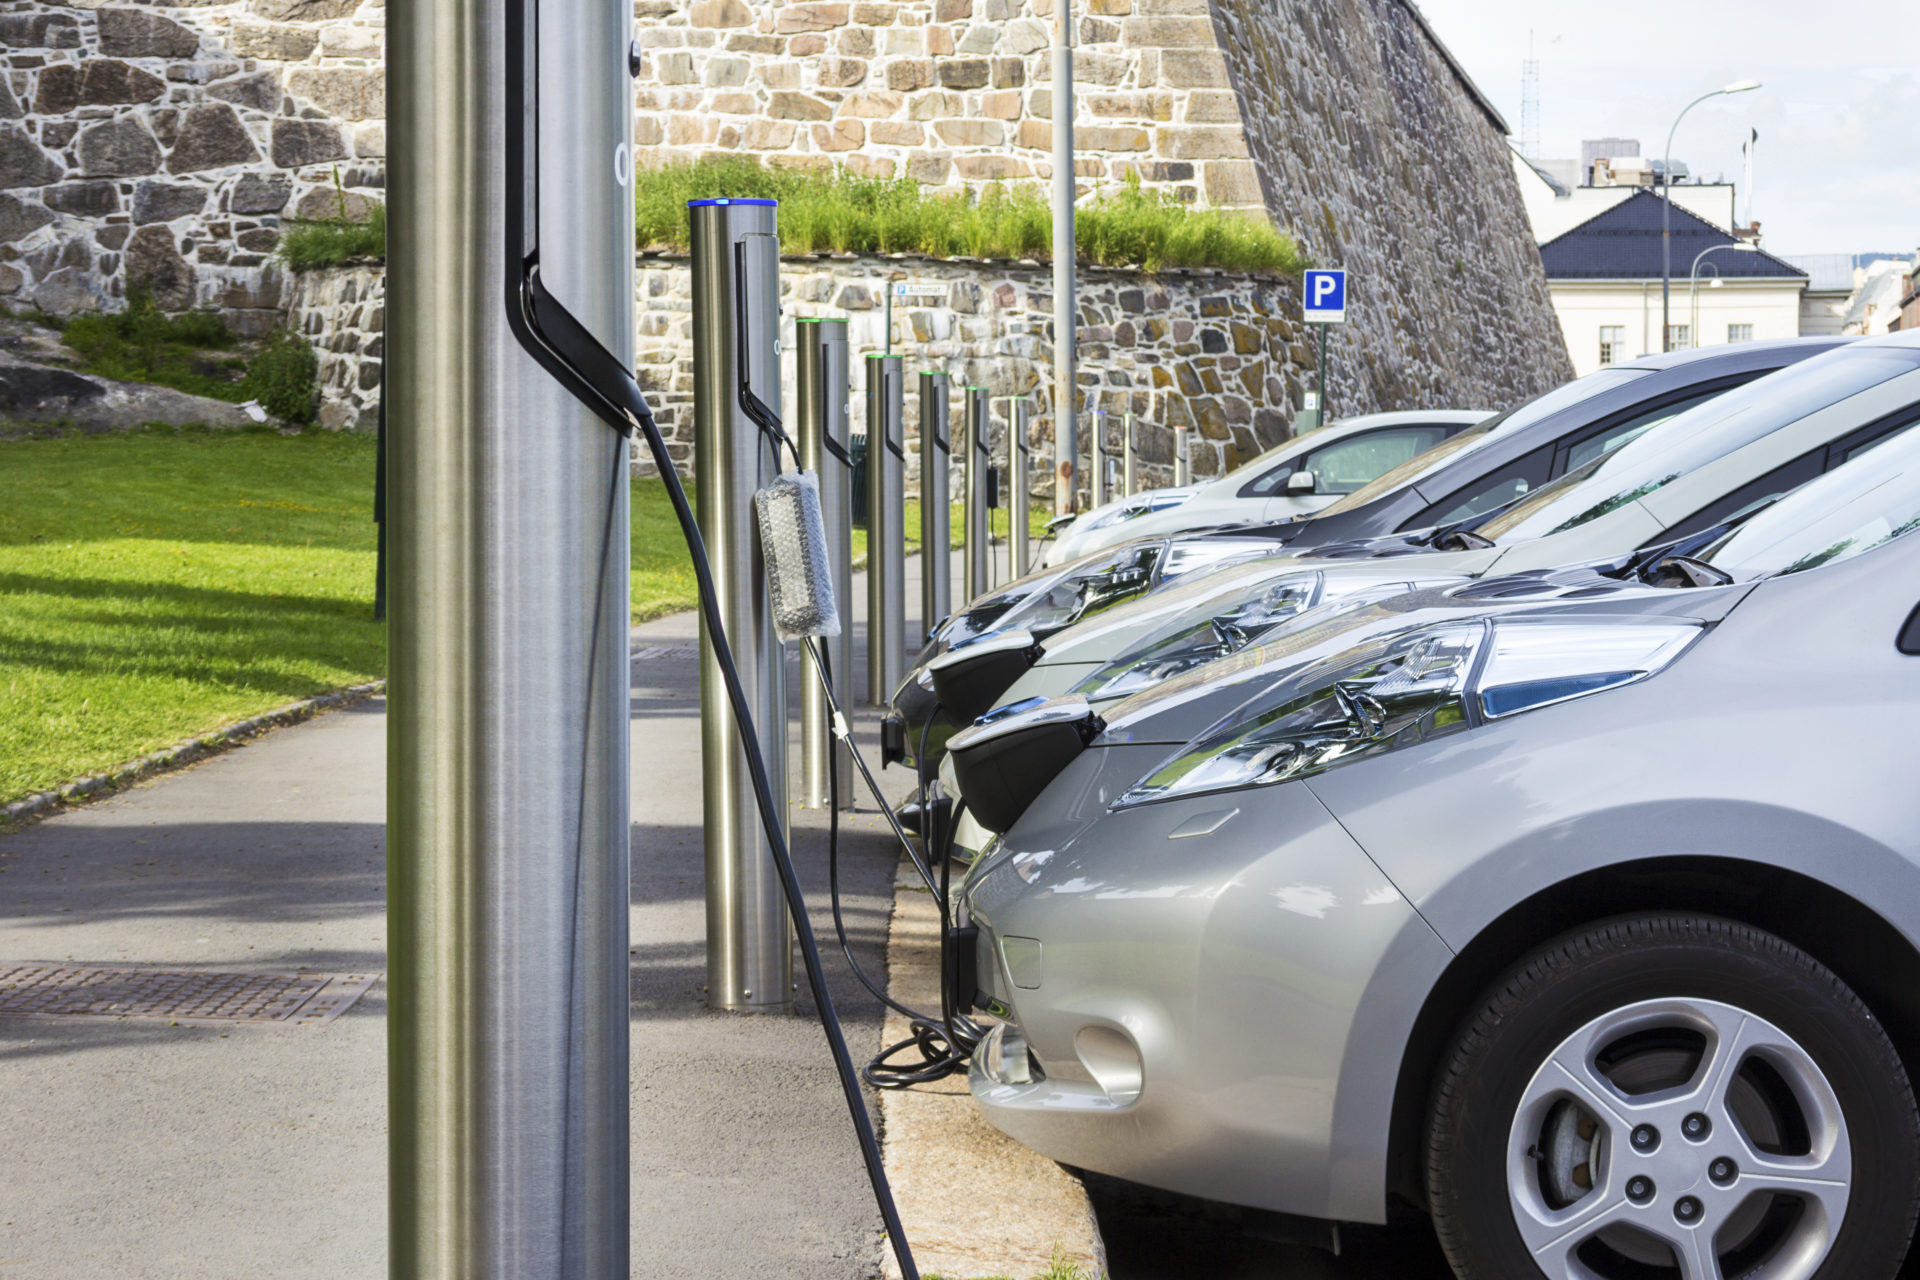
Norway is currently the largest market in the world for electric vehicles (EVs) in comparison to the total number of vehicles sold. The high number of EVs is due to good incentives. There is also a political goal to stop the sale of new conventional cars by 2025 (conventional cars use gasoline or diesel to power the engine).
A capacity problem – not an energy problem
The increased number of electric vehicles, and the 3 % increase in the Norwegian electricity consumption, will not be an energy problem. But it can be a capacity related problem in the distribution grid if all households are charging at the same time.
The results presented in this blog from the CINELDI – ModFlex-project, are based on a survey performed among households with electric vehicles (in cooperation with Elbilforeningen) and meter data of the energy consumption from charging. The data is collected from a selection of the most common electrical vehicles in Norway and the results were published at the UPEC 2018 Conference.
The status of electric vehicles in Norway
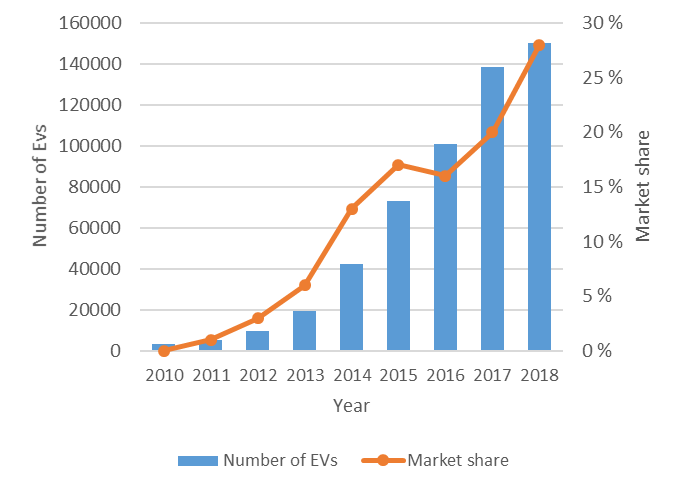
By the end of 2017 the total number of EVs in Norway was more than 142.000, including both private cars and vans. EVs represented approx. 5,6% of a total of 2,5 mill. private cars, and in 2018 EVs reached almost 30 % market share. Plug-in hybrids have a market share of 19 %. The development of the amount of private EVs in Norway, and their market share, is presented in Figure 1.
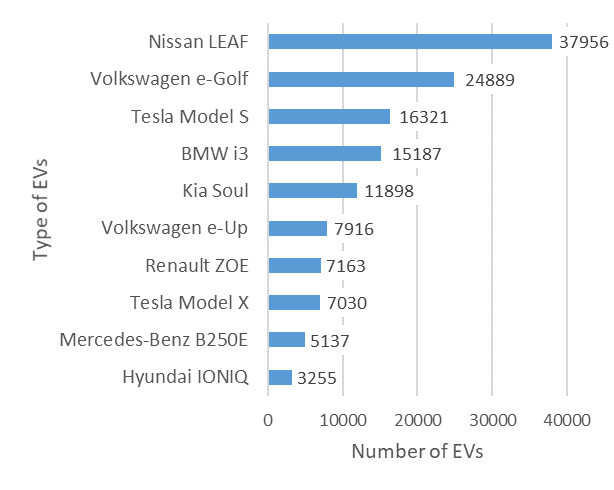
An overview of the 10 most popular types of electric vehicles in Norway, per 31 March 2018, is presented in Figure 2. Nissan Leaf is the type with the largest market share, with approx. 38.000 cars, with Volkswagen e-Golf as number two with approx. 25.000 cars. In total there is approx. 23.400 Teslas in Norway, split on both Model S and X. The other types of EVs among the top 10 in Norway are BMW i3, Kia Soul Electric, Volkswagen e-Up, Renault ZOE, Mercedes-Benz B250E and Hyundai IONIQ.
Mitsubishi i-Miev was one of the EVs that really sped up the EV market in Norway. This car was introduced in 2010, and in 2011 this EV represented 52% of the total number (1.040) of EVs sold that year [4]. Peugeot and Citröen released equal models, in cooperation with Mitsubishi – the so-called “triplets”. The “triplets” are Mitsubishi i-Miev, Citroën C-Zero and Peugeot Ion.
EV-surveys in 2017 and 2018
In 2017-2018, the CINELDI/ModFlex project cooperated with Elbilforeningen (the association for owners of EVs) on a survey directed at their members. The survey posed questions like:
- when and why they purchased an EV,
- when they normally charge the EV at home,
- and the potential for flexibility in the time of charging.
In total, 12 665 owners responded to the survey in 2017 and 9520 owners responded to the survey in 2018.
The results from the surveys give us an indication of the potential for demand response related to charging of EVs.
EV charging peaks in the afternoon and night
Some of the data from the survey in 2018:
- The households normally charge their EV daily at home, 59% of the single-family homes and 12% of the customers living in housing cooperatives.
- Public charging stations and fast charging stations are used monthly or less, by respectively 51% and 68% of the respondents. A fraction of the respondents use charging stations on a daily basis.
- 49,5% of the users charge their EV at home from a normal socket (typically 10 A), and approx. 43% of the users have a charging station at home, either 16 A (24,1%) or 32 A (18,9%).
In 2017 the customers were asked about which hours during the day they normally charge their EV at home. The results are presented in Figure 3, showing that most of the charging occurs in the afternoon and during the night. Very few respondents answered that they charge their EV at home during daytime (hours 11-16).
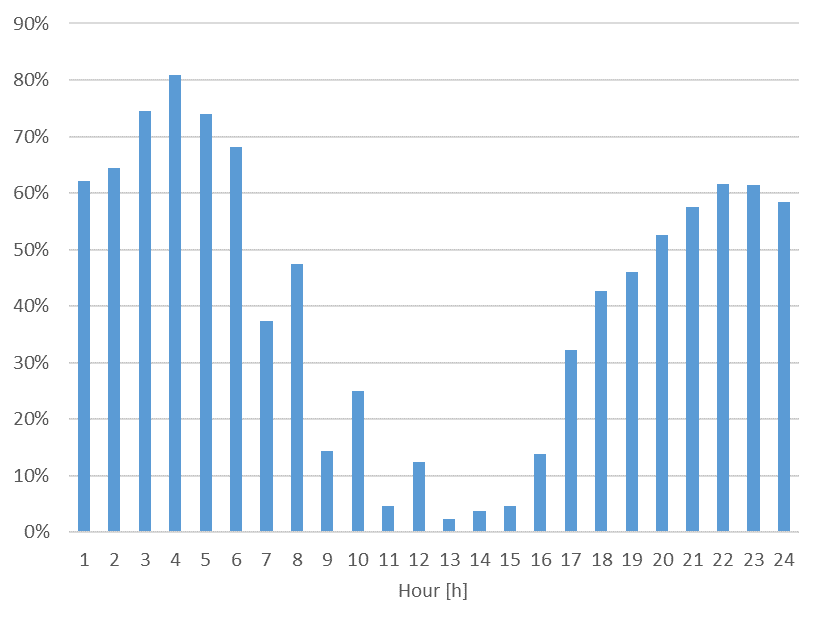
90% are willing to postpone the time of charging under certain circumstances, unless…
To map the potential for flexibility in time of charging, the respondents were asked about their willingness to postpone the time of charging from day/afternoon to night (hours 21-05). If this shift in charging time has no negative consequences for the user, 90% are willing to postpone the time of charging. However, if this reduces the driving distance the next day to 80%, the share of positive respondents is reduced to 56,5%.
Looking at Figure 3, this would imply a reduction of EV owners charging in the afternoon, and an increased share charging during night time. The figure shows that there are several customers already charging during nighttime, and that there’s potential for more to do this. The reason for this is that the charging in the afternoon starts in a period when there is already high consumption at households due to cooking, washing clothes etc. Appliances such as washing machines and dishwashers should not be shifted to night time, but the charging of the EV could be shifted.
- 38,2% of the respondents were positive to this change in time of charging if they save 200 €/year.
- A lesser amount (26,4%) of the respondents were positive if the savings are reduced to 50 €/year.
New EVs charge smoother
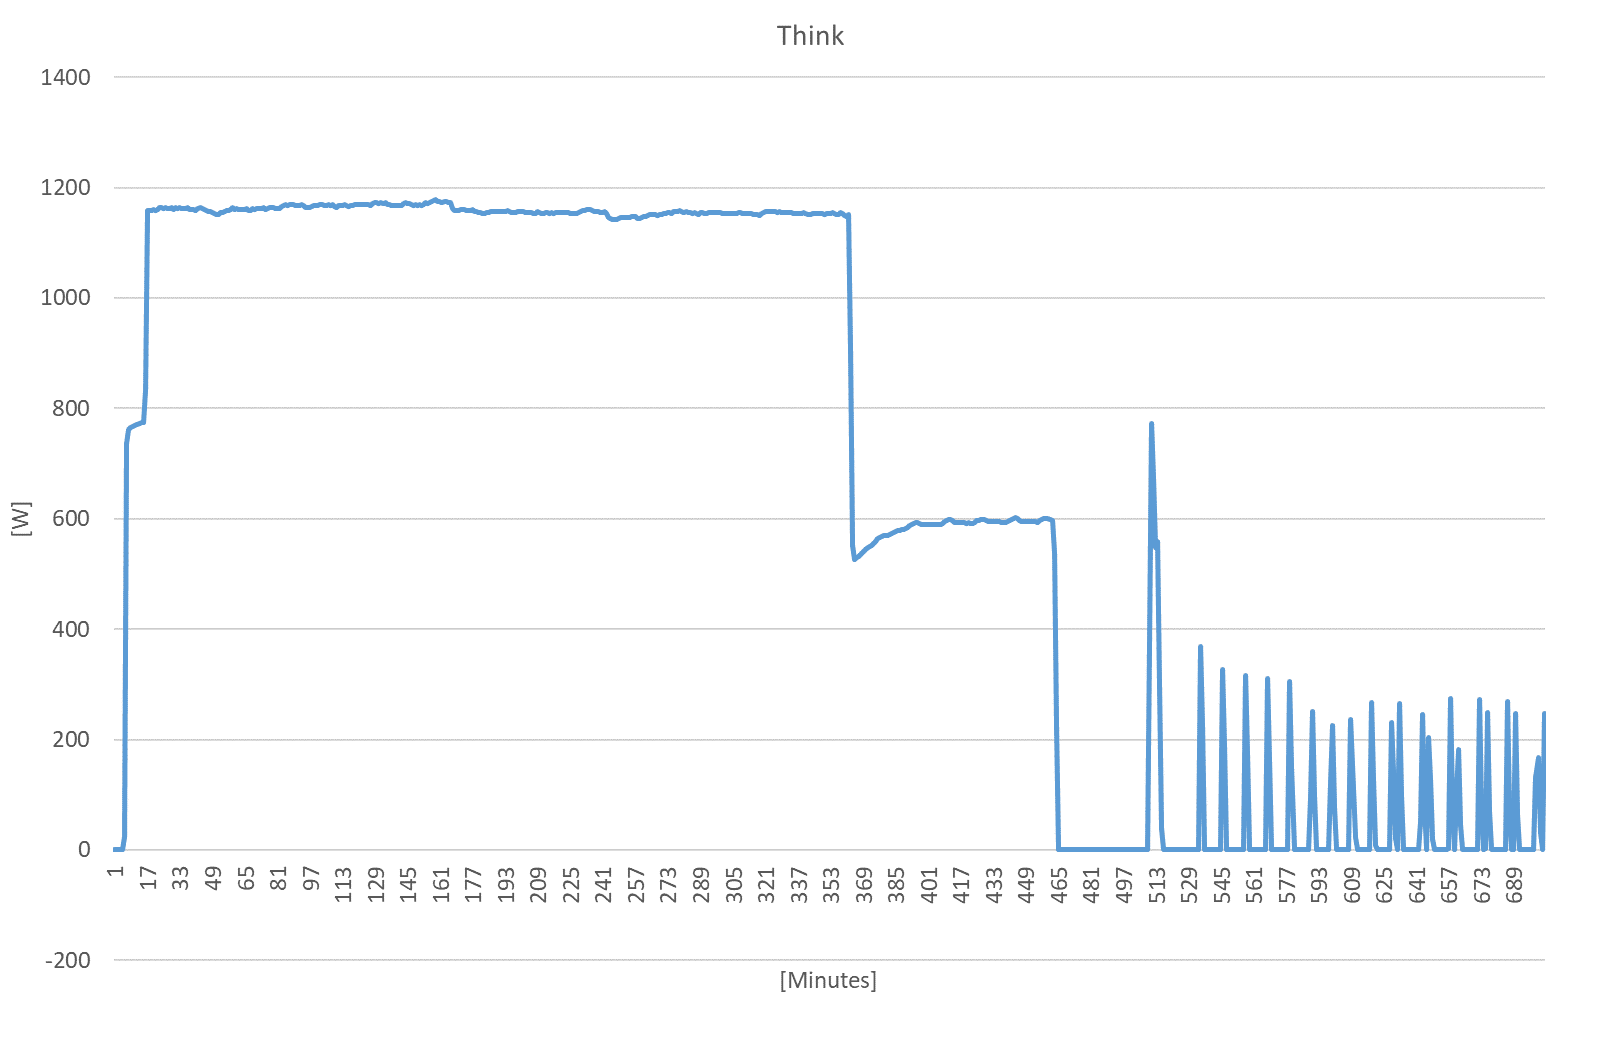
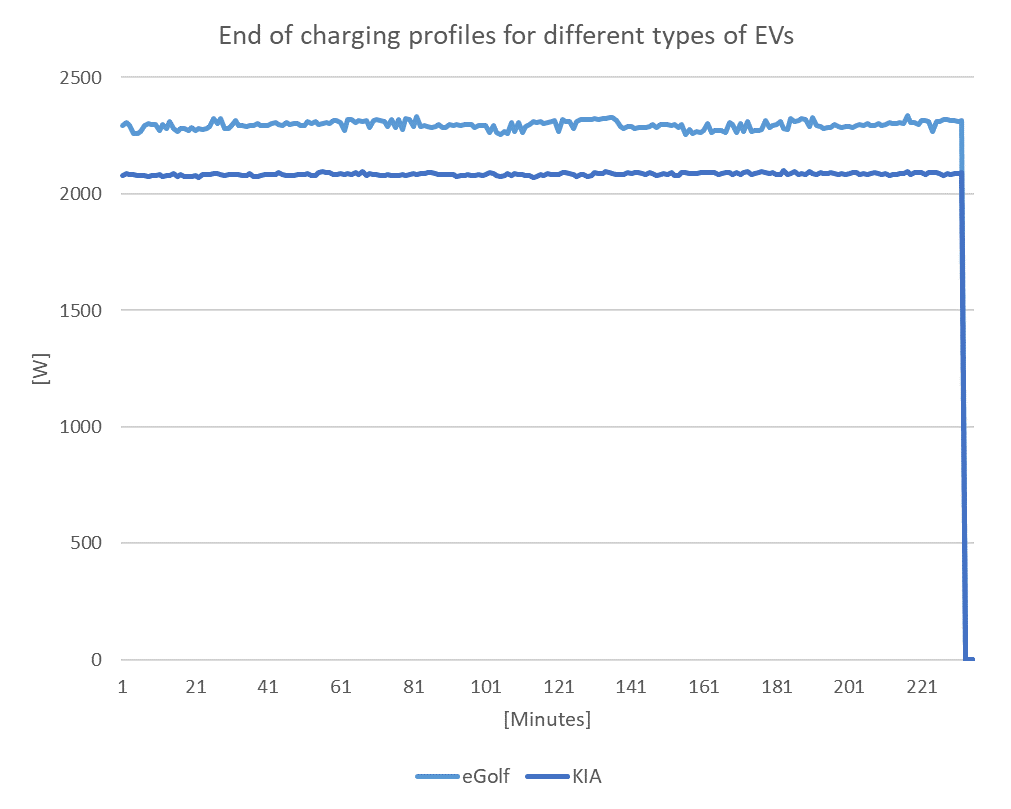
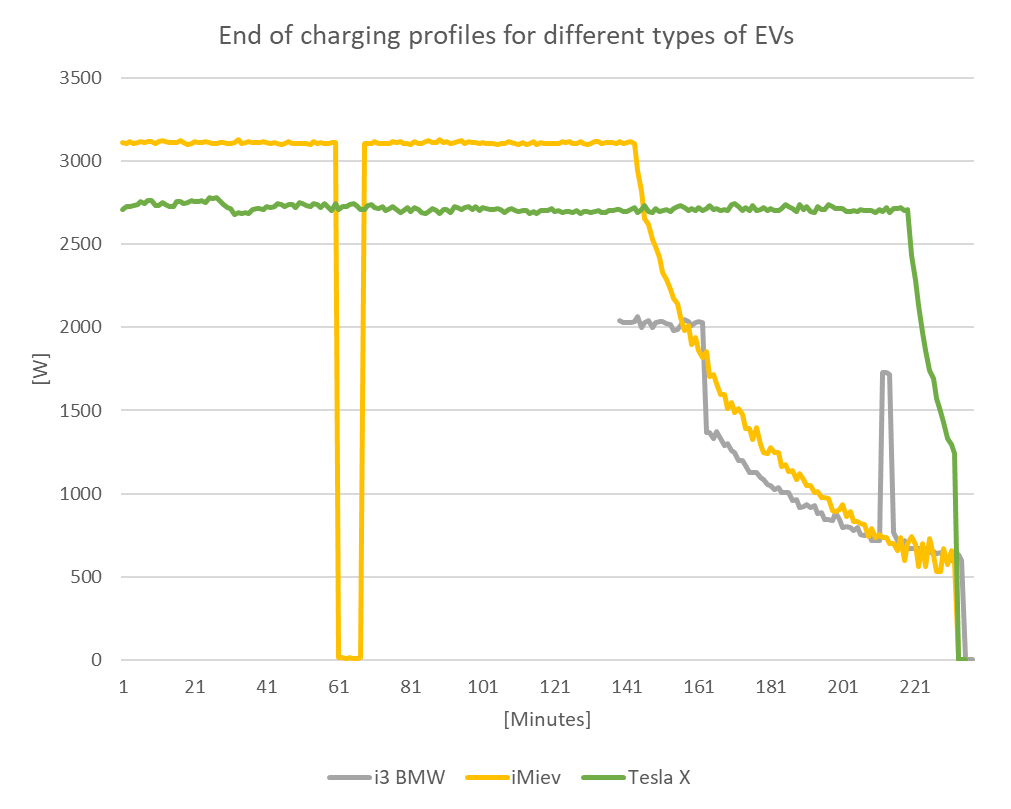
The electricity used for charging in this project has been metered with a 1-minute resolution, for different types of EVs. Metered charging profiles for selected EVs are shown in figures 4, 5 and 6. The meter data shows that the charging profile for new EVs are smoother (step-down and instant on/off – Figure 5 and 6) than the charging profiles for the first EVs on the market (maintenance charge mode – with rapid on/off at the end – Figure 4). Based on the metering of different charging profiles, they have been divided into three groups:
- Maintenance charge mode
- Instant on/off
- Step-down
Since the duration of charging depends mostly on the state of charge of the battery, and since the charging occurs at maximum capacity available in the socket, the focus of this study has been on what happens at the end of charging.
Electric vehicles has flexibility potential
EVs are new loads for most households, which has not settled into a regular habit with respect to charging/time of use. With the potential to store energy in a battery, EVs have a flexibility potential and are candidates for demand response (load shifting, peak clipping, valley filling).
Several of the EVs (especially the newer EVs) have the potential for controlling the start of the charging and/or specifying the time when the EV should be fully charged. This can be controlled via a smartphone app or through the EVs onboard display.
Load shifting and valley filling: With the smartphone functionality, it is easy for the user to control the time of charging – e.g. for load shifting (move the charging away from peak load periods) and valley filling (charging the EV at night). When controlling the charging from the smartphone app, the manufactures onboard charging method for start and stop of charging is used, which ensures a smooth start and stop.
Peak clipping: There is also a potential for demand response from EVs by peak clipping, done by interrupting the charging (on/off). If this interruption is performed when the EV is charging at maximum capacity, the charging will restart again with the same load, and the end of the charging time will be postponed.
Consequences of interruptions
In the CINELDI/ModFlex project, the consequences of interruptions during the step-down part (Figure 6), has been studied (see Figure 7). This study has been performed on a Mitsubishi iMiev. Figure 7 shows the step-down part of the charging, with two interruption periods followed by a rebound effect when the charging restarts.
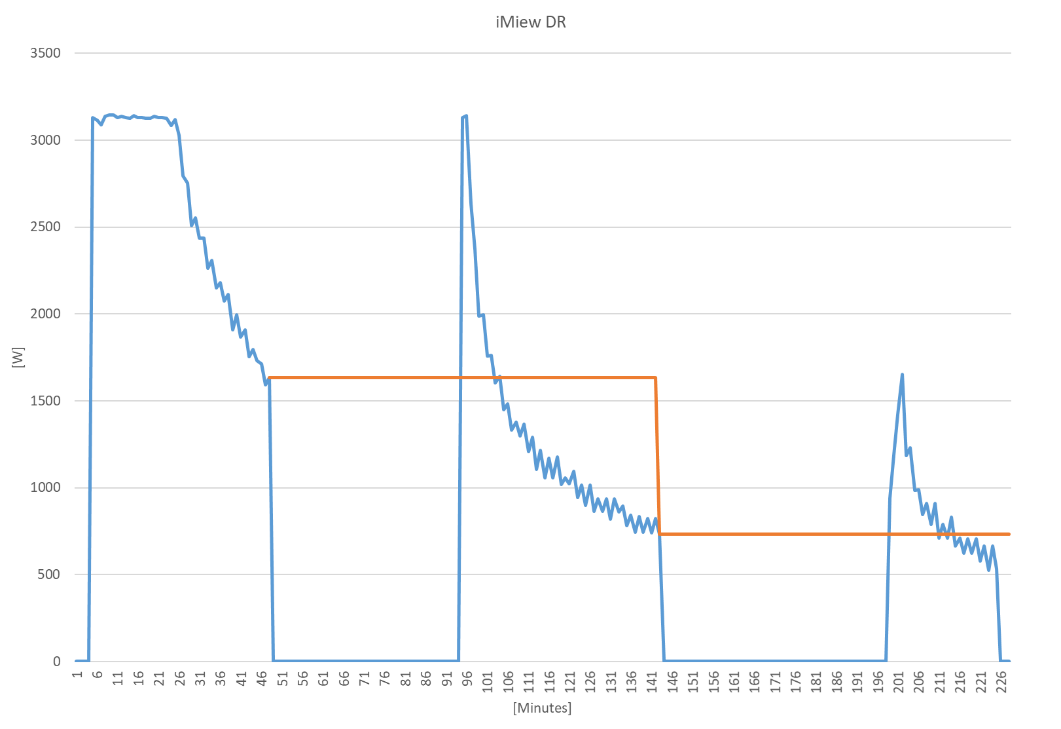
The step-down charging process starts from approximately 3,1 kW. The first interruption occurs when the charging is at 1634 W. After a break of 46 minutes, the charging starts at 3132 W, and it takes 10 minutes before the charging level is back at the charging level before the interruption. The second interruption occurs when the charging level is at 734 W.
After a break of 55 minutes, the charging level restarts at 940 W for the first minute, and then further increases to 1189 W. It takes 14 minutes before the charging again is at the same level as before the interruption.
The figure shows that after a disconnection during the step-down period, the charging power increased and a rebound effect occurred.
More EVs is not an energy related problem
In Norway the increasing amount of EVs will not be an energy related problem, but rather a capacity related problem in distribution grids if all households are charging at the same time – in addition to their usual consumption of electricity.
Since EVs are new loads for most households, which has not settled into a regular habit with respect to charging/time of use and the flexibility potential due to the battery, EVs are good candidates for demand response.
Households could therefore be incentivized to charge in off-peak periods (during the night), to utilize existing capacity of the distribution grid, which can be realized through for example new capacity-based grid tariffs and/or local markets for flexibility.
- Want to know more about demand response? Find out more at CINELDI – Centre for Intelligent Electricity Distribution.
Hello, if the rate per kWh for energy usage was reduced during night time hours would this not incentivise owners of EVs to charge their vehicles at night ?
Yes, reduced rate per kWh is one alternative to incentivise customers to smart charging of their electric vehicle. This can be given for example via an energy contract with hourly spot prices or a time-of-use grid tariff. Research is also focusing on incentives for stimulating to a more flexible demand.
Pingback: This is how we reduce data centers’ carbon footprint - #SINTEFblog
Pingback: Slik gjør vi datasenter mer miljøvennlig - #SINTEFblogg
Pingback: A flexible power grid: what is it and why do we need it? - #SINTEFblog