NCCS (Norwegian CCS Research Centre) facilitates scientific support for the injection and storage of CO2 into subsurface aquifers of the northern Horda Platform, Norwegian sector of the North Sea. Recently, Dr. Mark Mulrooney explained the primary research questions that NCCS addresses in its structural derisking work (task 9).
Fundamentally, the research is trying to assess the reactivation potential of heterogeneities (e.g. fractures, faults) intersecting the caprock and as such determine caprock integrity. This investigation relies primarily on geophysics, with in situ characterisation literally out of reach – but not at the geologically-similar caprock succession that outcrops onshore Svalbard.
This succession has previously been investigated as a potential caprock by the University Centre on Svalbard (UNIS) CO2 Lab, providing a wealth of multi-scale, multi-physical data.
My PhD relies heavily on these data sets as we investigate the multi-physical detection limit of fluid flow through caprock sequences. This investigation bridges the NCCS work on structural derisking and cost-efficient monitoring (tasks 9 and 12). It uses Svalbard as an extensive outdoor laboratory to acquire data for rock physics models and relations that help us better predict fluid flow and the detection thereof following a breach.
Learn more about CCS
Join our newsletter to stay updated with all the latest research results and news from NCCS: The Norwegian CCS Research Centre.
A need for quantitative data
A rock physics model is a set of equations and statistics that captures the various relationships between physical properties for a particular rock type or formation. In other words, rock physics models provide a link between the (known, directly measurable) rock properties and the (unknown, resulting) properties picked up during e.g. seismic and electromagnetic exploration.
The more data we acquire on a sample, an interval, or even a formation, the better we can correlate these different properties to one-another. In turn, this allows us to better predict properties for unsampled intervals, provided at least some of the properties are known in the first place.
With 8 fully cored boreholes supplemented by wireline logging, the UNIS CO2 Lab data provides us with many (but not all) of the key properties needed to enable the use of rock physics for the characterisation of the caprock sequence onshore Svalbard. Where insufficient data are available, the drill cores are accessible and additional data can be acquired to fill the gap.
The qualitative density wireline logging was identified as one such gap. While it identifies and defines broader trends in lithology, rock physics correlations require more discrete and quantitative logs than the data set provides. As a result, quantification was a necessity.
Bulk density measurements from structure-from-motion photogrammetry
Had we relied on conventional methods to acquire further density measures to quantify the log, a bucket of water and a scale would have sufficed for the industry-standard immersion in fluid method. However, this established (but somewhat crude!) method risks destroying the shale-dominated samples, even when applying protective measures such as waxing. Instead, we decided to see whether anyone had tried determining densities through structure-from-motion (SfM) photogrammetry.
While slowly embracing SfM photogrammtry as an aid for certain geotechnical measurements, none in the geosciences had so far implemented SfM-based workflows as part of the digitisation of centimetre-scale geological samples, let alone using off-the-shelf components. SfM photogrammetry is traditionally used in the geosciences to investigate much larger scales, e.g. to acquire virtual outcrop models (VOMs) and digital elevation models (DEMs). The technique is also extensively used for large scale volume and density measurements as part of e.g. snow and avalanche studies, and forms one of the digital cornerstones for modern archaeology and palaeontology.
Photogrammetry allows for the estimation of such three-dimensional (3D) structures from two-dimensional (2D) image sequences, in similar fashion to how our own eyes recover 3D structure from the 2D image seen by each eye. To quantify distances and height, our eyes often rely on such references as scales and rulers (or on landscape scales, trees). A similar approach can be implemented in SfM photogrammetry through ground control points (GCPs). These add real world coordinates to the synthesised 3D models and allow for sub-millimetre resolutions in the process.
Aware of this potential, we decided to implement and see whether SfM photogrammetry could be used as a semi-automated, equally-performing, modern reincarnation of traditional characterisation methods. In particular, we were keen on finding out whether it could be used as a modern alternative to such methods as the immersion in fluid method for determining bulk volumetrics and densities.
The synthesis of digital drill core models (DCMs) relied heavily on GCPs, and after several weeks of finetuning the workflow, DCMs were acquired with sub-millimetre spatial errors. This process only takes about half an hour from photography-step to final model, and the process is one that can be run in parallel fashion. Some 25 DCMs were generated from drill core samples spanning the caprock sequence penetrated by Longyearbyen CO2 Lab borehole DH4.
Subsequent to SfM photogrammetry processing, some of the drill core samples were sent to the Norwegian Geotechnical Institute (NGI) in Oslo, where the conventional immersion in fluid method was used to determine bulk volumes and densities. Strikingly, the bulk volumes (and derived densities) derived digitally matched the geotechnical measurements almost exactly, with a mean deviation of 0.3% between both methods for the eight measured volumes.
Splicing, synthetic televiewer data and digital characterisation
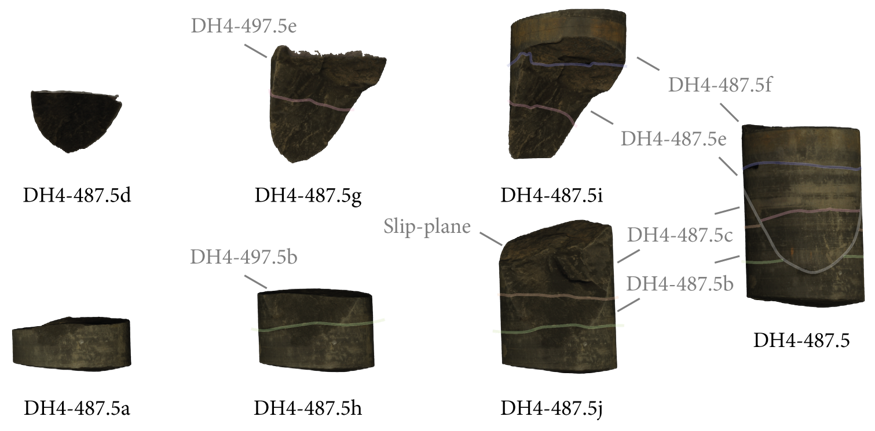
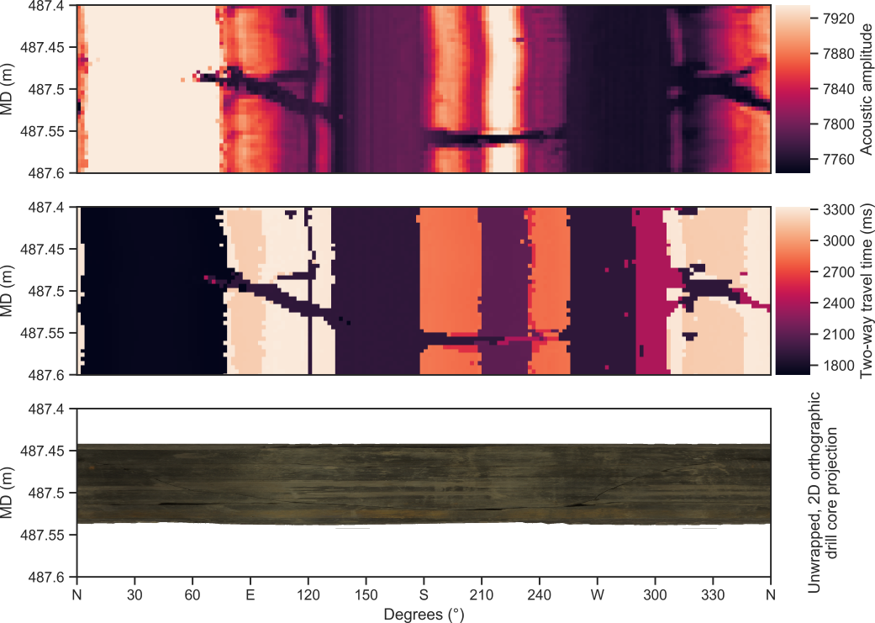
To quickly assess the characterisation-potential, other drill cores were selected for core reconstruction and digital characterisation. The characterisation of VOMs is often done through use of 2D orthoprojections, and a similar approach was tried for DCMs. Unlike for VOMs, for which the 3D surface is projected onto a 2D plane, the DCM surfaces were projected onto a cylindrical mesh wrapped around the DCM. In essence, unwrapping of the mesh then yields synthetic optical televiewer data for a particular interval that may be further analysed with tools traditionally developed for the characterisation of VOMs.
Additionally, the synthetic optical televiewer data is directly correlatable to conventional televiewer data sets, and we were able to align our synthesised interval with the acoustic televiewer data obtained from Longyearbyen CO2 Lab borehole Dh4. This allowed for the determination of both in situ orientation and position, observations that could now easily be extended to the remainder of the drill cores through digital core reconstruction. The synthesised synthetic televiewer interval, namely, was the projection of a composite core reconstructed from six smaller fragments, showing that we can successfully splice fragments into larger core segments through digital processing.
A digital drill core library and the way forward
We are currently expanding this digitisation effort to cover the entire cored caprock sequence of the Longyearbyen CO2 Lab by digitising drill cores at 1 metre intervals. Not only does this provide us with the data needed to quantify the density logs, it also enables the establishment of the very first digital drill core library. All acquired DCMs will eventually be integrated with Svalbox.no, an initiative trying to provide an interactive frontend to all geoscientific data originating from Svalbard.
This integration paves the way for the characterisation and implementation of DCMs as input for big data workflows, and ensures scientific reproducibility long after the destruction of the original sample.
Learn more about CCS
Join our newsletter to stay updated with all the latest research results and news from NCCS: The Norwegian CCS Research Centre.
More information can be found in the following scientific publication:
Betlem, P., Birchall, T., Ogata, K., Park, J., Skurtveit, E., & Senger, K. (2020). Digital Drill Core Models: Structure-from-Motion as a Tool for the Characterisation, Orientation, and Digital Archiving of Drill Core Samples. Remote Sensing, 12(2), 330, https://doi.org/10.3390/rs12020330.



Comments
Hard work and long hours pay off, Peter! Good work.
Great to see more use of digitization of “rock-hard” data in geoscience.
Rock solid hours pay off indeed! 😉 And I couldn’t agree more – definitely a need for more digitisation of data in the geosciences. Let’s hope this brings us yet another step closer to that realisation.
See you back north before too long!