Guest blogger: Elisabetta Mecozzi, Head of Structural integrity department at Centro Sviluppo Material (CSM)
The researcher take part in the IMPACTS project: IMPACTS is a collaborative project co-funded by the European Commission under the 7th Framework Programme. IMPACTS is run by SINTEF Energy Research. Find out more about IMPACTS.
Work Package 1.4 in the IMPACTS project aimed at studying the effects of the impurities in carbon dioxide (CO2), in liquid or supercritical phase, on different carbon steel grades.
To the purpose two different tests have been carried out:
- Uniform corrosion tests, performed in Tsinghua University, to investigate the effects of water (H2O), temperature, pressure, and rotation rate on corrosion rates in supercritical carbon dioxide (SC CO2).
- Stress corrosion tests, performed in CSM, to investigate the effects of water (H2O), hydrogen (H2) and hydrogen sulphide (H2S), at different concentrations in liquid (CO2liq.) or supercritical carbon dioxide (CO2SC).
Uniform Corrosion in CO2 mixtures
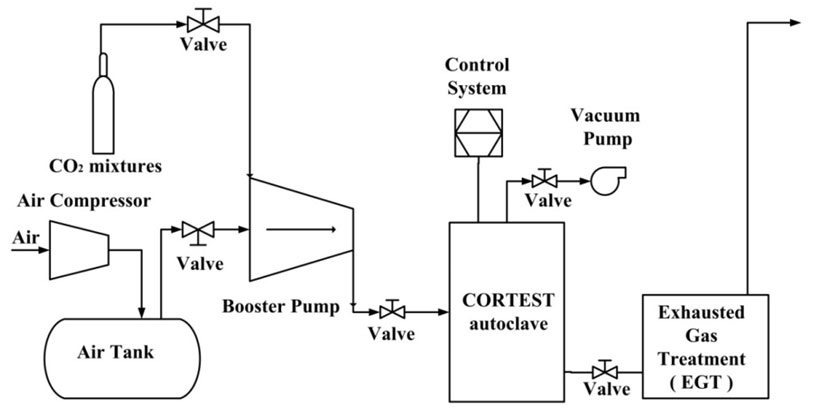
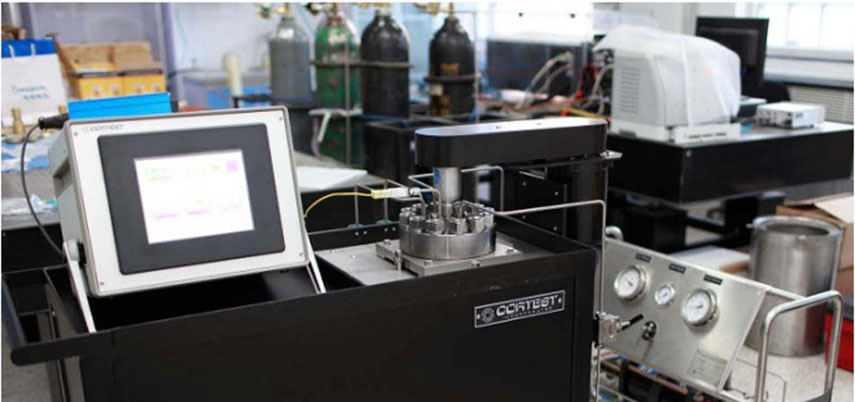
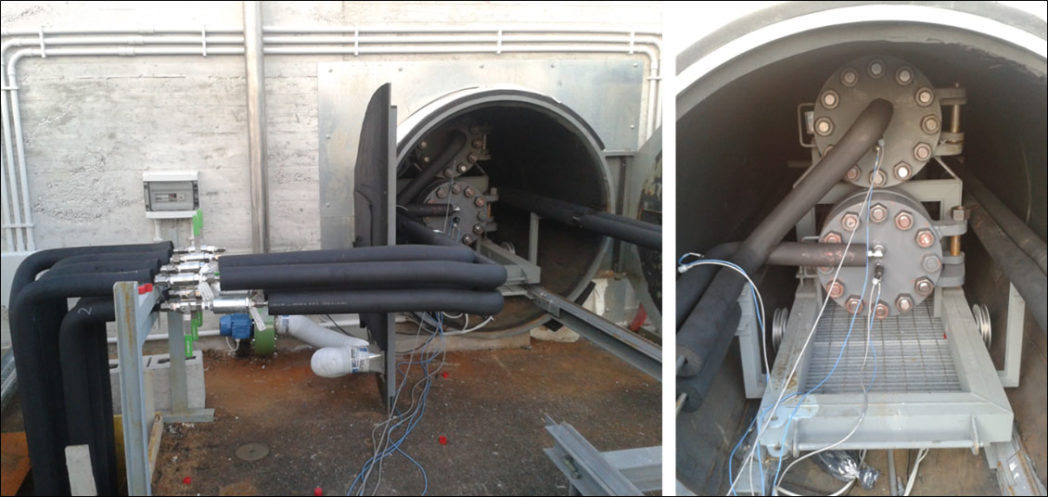
Figure 1 provides the schematic illustration of the experimental system layout. The entire system consists of a 2.2 L capacity autoclave in Figure 2, CO2 mixture cylinder, a pump, a temperature and pressure controller system and tail gas treatment facility.
The carbon steel samples used for the testing program are listed in the following:
- X70
- X65
- X60
- X80
Two 20 x 20 x 2.6 mm tablet specimens were used to calculate the average corrosion rates and exposed to several environments for 72 hours for each type of carbon steel.
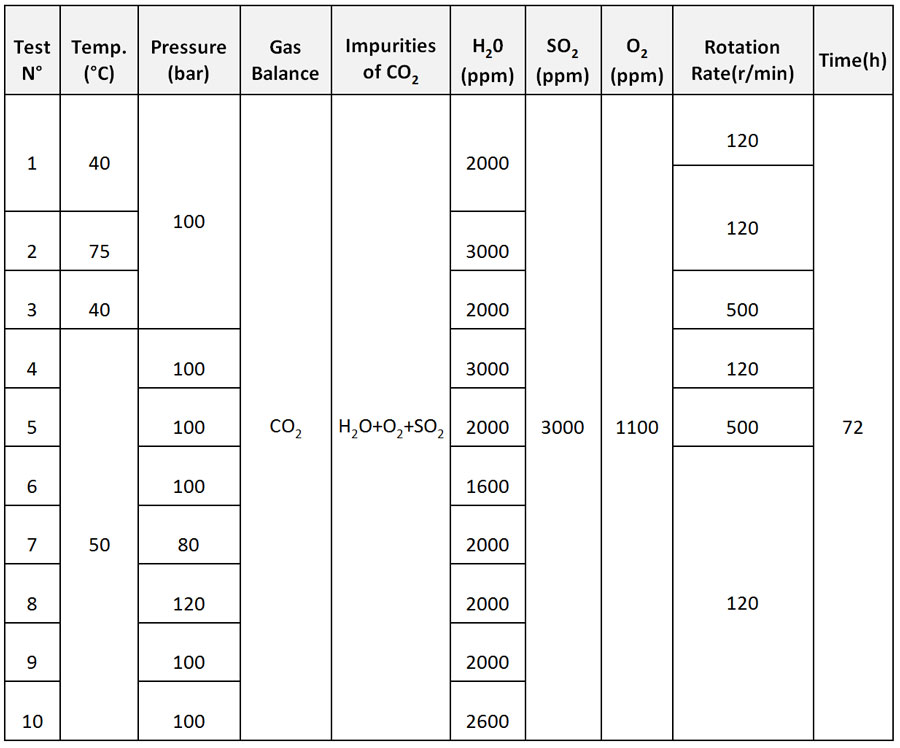
Based on the results of the Impacts Project no. 308809, 10 test environments were selected. The details of the test conditions are shown in Table 1.
The post-test examination process were consisted of the follows:
- Weight loss method is applied to obtain the average corrosion rate.
- Scanning electron microscopy (SEM) is used to analyse the product morphology.
- Energy dispersive X-ray spectroscopy (EDS) and X-ray diffraction (XRD) are used to anlayse the product compostion and crystallization
- 3D measuring laser microscope (LEXT OLS4100, OLYMPUS) was also employed to examine sample surface and determine the localized corrosion after cleaning the product scale.
Figure 3 shows as example, the average corrosion rates results to determine the effect of water content by comparing test N° 4, 6, 9 and 10.
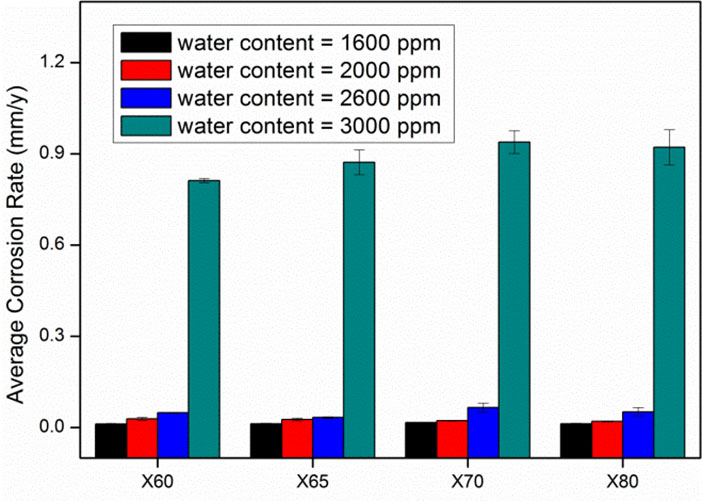
Figure 4 and Figure 5 show the photographic investigation and the SEM images of the samples tested (X60, X65, X70 and X80 steel) after test N°1. Table 2 shows the EDS results for the region A1-A4 labeled in Figure 5.
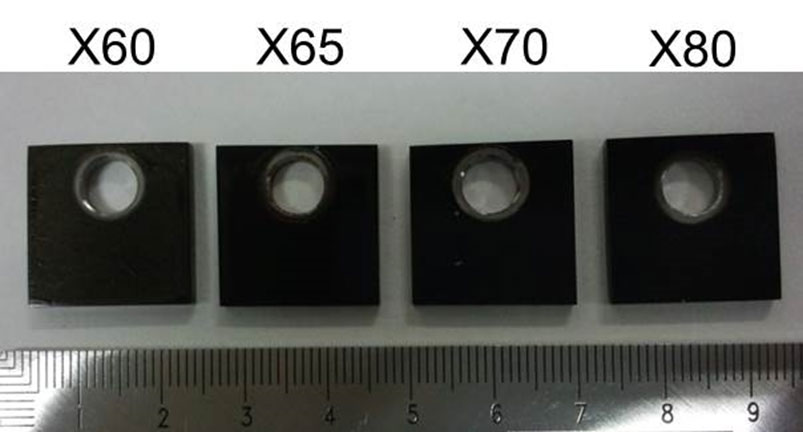
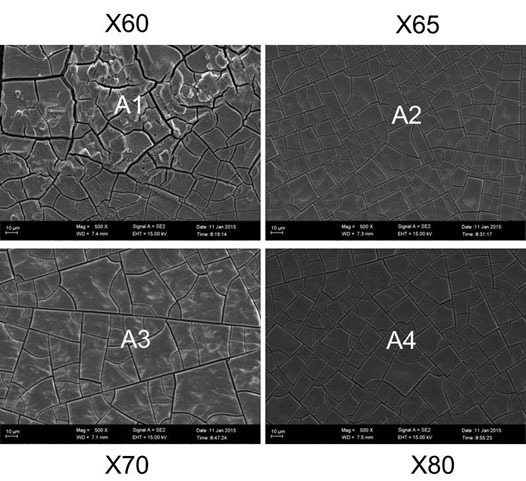
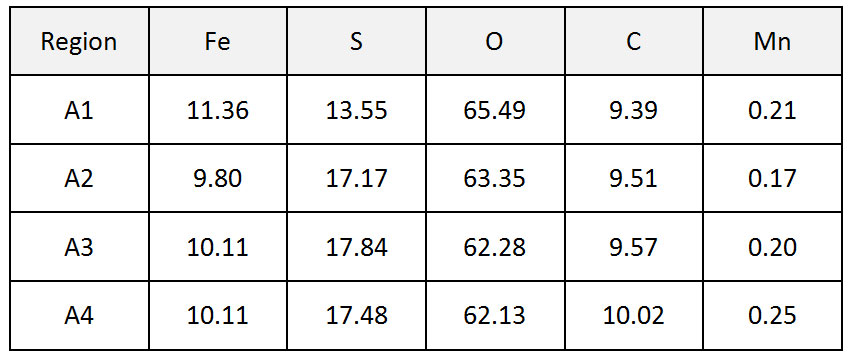
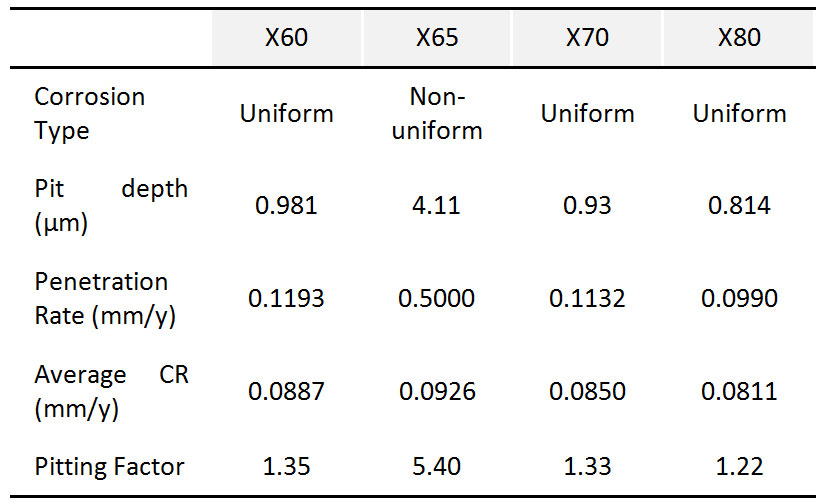
Figure 6 shows as example, the 3D surface morphology for carbon steel samples after cleaning the product. The evaluation of whether localized corrosion happened is listed in Table 3.

Basing on the obtained results, the conclusions can be summarized as follows:
- Experimental results show that the average corrosion rates increase with moisture. The critical humidity is 2600 ppm, after which the average corrosion rate rises rapidly. The safe limit of moisture for X60, X65 and X80 steel samples is 1600 ppm, while the safe limit of moisture for X70 steel is below 1600 ppm.
- Experimental results show that average corrosion rates at 8 MPa are higher than those at 10 MPa for X60, X65, X80 steel samples, but nearly the same for X70 steel samples. Corrosion rates at 12 MPa are nearly the same as those at 10 MPa for all steel samples.
- Experimental results show that average corrosion rates decrease with temperature.
- Experimental results show that average corrosion rates slightly decrease with rotation rate.
Stress Corrosion in CO2 mixtures
A supercritical and liquid CO2 mixture plant (see Figure 7) has been used to carry out Stress Corrosion Cracking tests in CO2 environments.
Carbon steel pipe samples were used for this testing program as follow:
- X70
- X65
- X60W (welded)
- X60
The test program was performed by Four Point Bent Beam (FPBB) test method. 115 x 15 x 5 mm FPBB specimens, in duplicate, were loaded at 90 % and 72 % AYS and exposed to several environments for 720 hours.
Based on the results of the Impacts Project no. 308809, 8 test environments were selected. Table 4 reports the tests conditions:
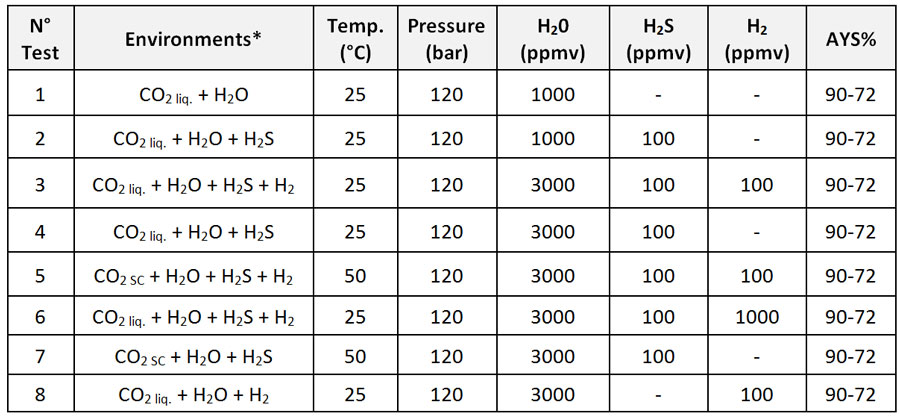
(*The environments were refreshed every 360 hours)
Post-test examination consisted as follow:
- Stereo microscope (SM) examination up to 40X magnification to determine the presence of cracks or localized corrosion.
- Cross section analysis in order to assess crack morphologies by means of Optical Microscopy (OM). Sections were taken at 1/3 and 2/3 of the sample width.
Figure 8 shows as example, the FPBB sample surface for X60 material. No evidence of cracks were observed by stereo microscope, up to 40x magnification.
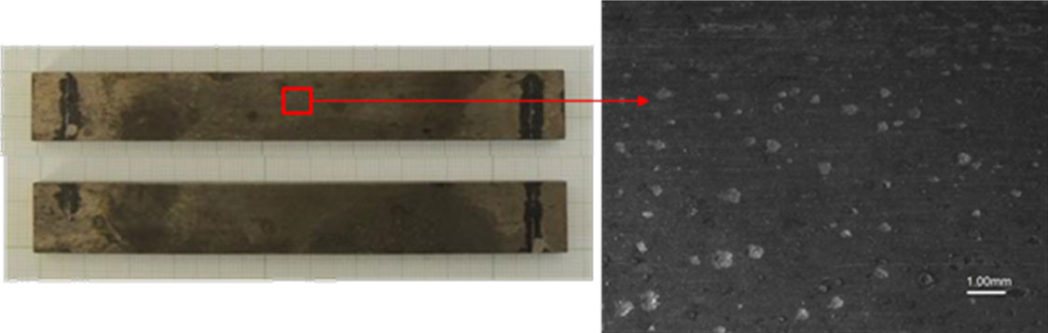
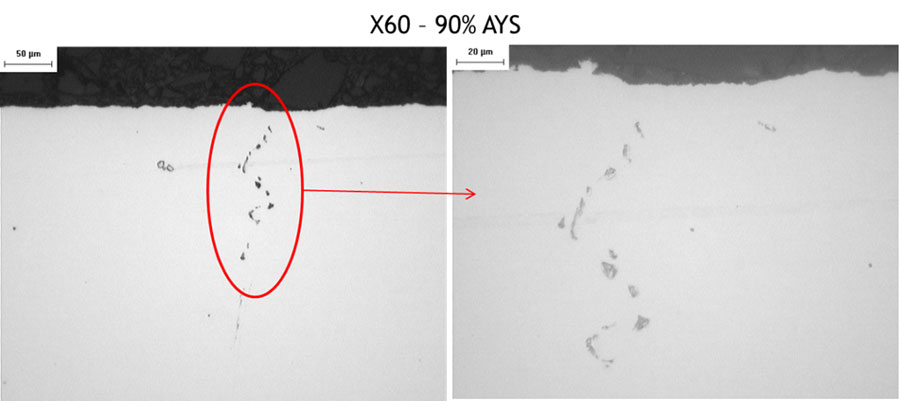
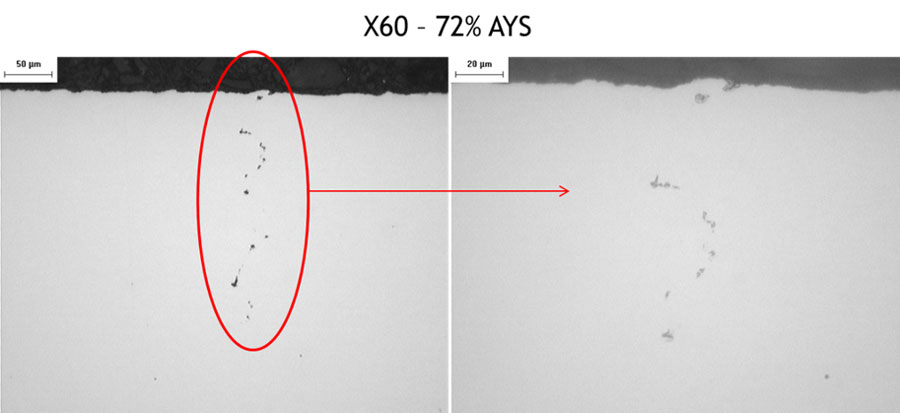
Figure 9 and Figure 10 show the cross sections of the samples tested (X60) at 90 % and 72 % AYS, after test N°5. The presence of stress oriented hydrogen induced cracking (SOHIC) was observed.
Basing on the obtained results, the conclusions can be summarized as follow:
- In the range of the impurities tested, on all materials Stress Corrosion Cracking (SCC) was not observed both in CO2liq. and CO2SC.
- The effect of the impurities was more critical in supercritical carbon dioxide than in liquid carbon dioxide.
0 comments on “Corrosion potentials in CO2 infrastructure – IMPACTS WP1.4”